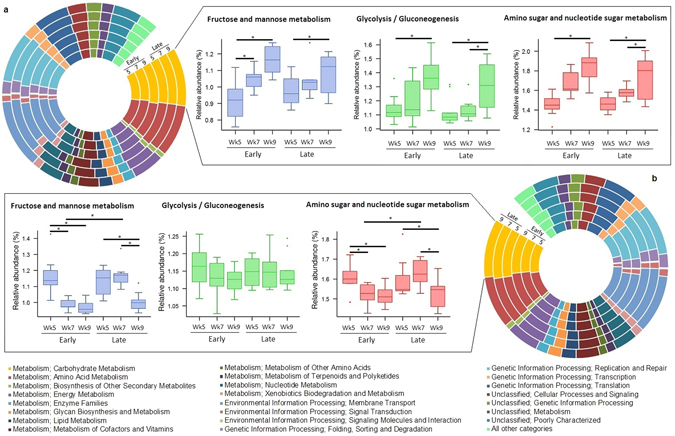
Figure 6.

PICRUSt predicted summary of COG categories from 16S amplicon sequencing of (a) ruminal and (b) faecal microbiomes. Relative abundances of Level 2 KEGG pathways are depicted by calf age within treatment group (weaning age) in circular barplots. Relative abundances of the three most abundant L3 KEGG pathways involved in Carbohydrate Metabolism (Fructose and Mannose Metabolism, Glycose/gluconeogenesis and, Amino sugar and nucleotide sugar Metabolism) at different ages (5, 7, or 9) subjected to weaning at either 6 weeks (Early) or 8 weeks (Late) of age are also presented within the boxes. *P < 0.05 for the shown comparisons of L3 pathways (See Supplementary Tables 3–6 for complete KEGG data).
