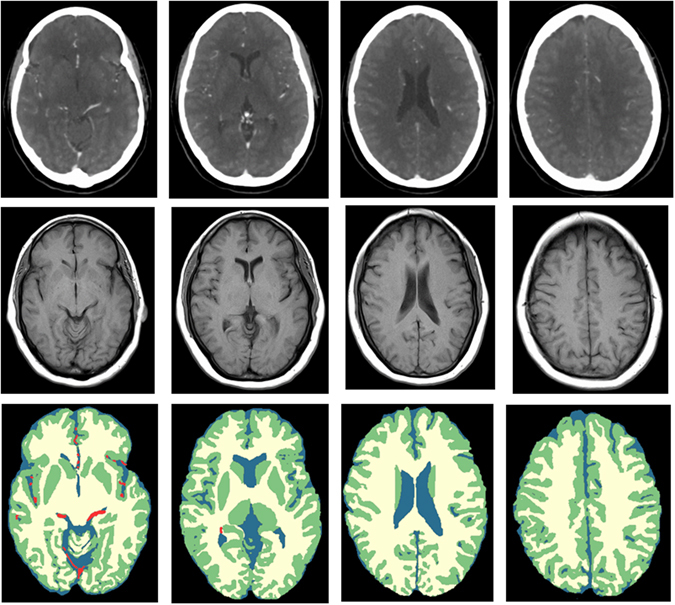
Figure 7.

Axial slices at approximately the level of the Circle of Willis, basal ganglia, lateral ventricles and centrum semiovale (from left to right). From top to bottom: WTA (window width/level 300/100 HU); the registered MR T1w image; the final segmentation after manual refinement showing CSF (blue), WM (yellow), GM (green), and blood vessels (red).
