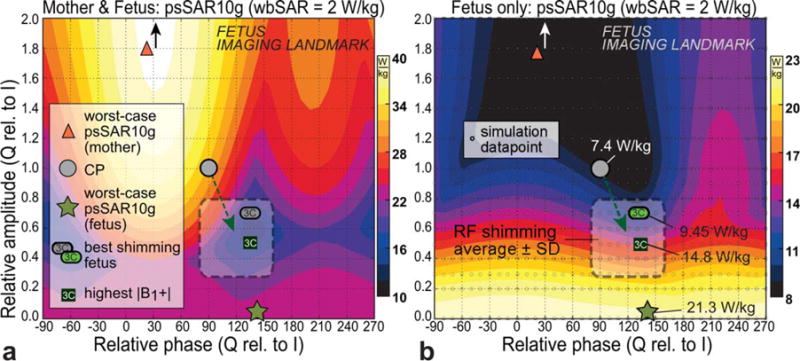
FIG. 4.

psSAR10g within the RF shimming parameter space for the reference scenario, for the mother including the fetus (a) and the fetus only (b). When compared with CP, the typical RF shimming excitations tend to lower the psSAR10g in the mother but increase SAR in the fetus (see dashed green arrow). Worst-case psSAR10g for the mother is outside of the graph at 2.2× and 30° (black/white arrows). The typical RF shimming region is indicated (from Fig. 6). The simulation data points underlying these interpolated graphs are shown in (b).
