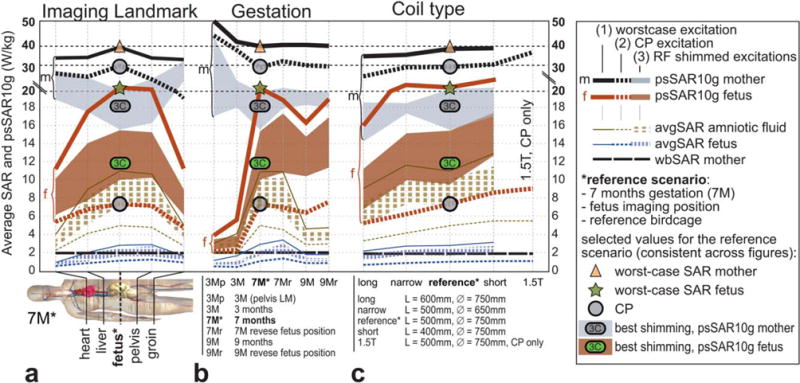
FIG. 5.

Influence of imaging landmark, stage of gestation, and coil type on the psSAR10g and average SAR of mother, fetus, and amniotic fluid. (a) Fetus-centered imaging landmark (*) indicates the highest SAR levels for the fetus. (b) Model at the seventh month of gestation (7M*) has a higher SAR than the other pregnant models. (c) Four body coil dimensions at 3T and one at 1.5T coil in CP mode only; only the short coil induces more SAR than the reference* coil. Triangle, circle, and star signs correspond to the values in Figure 4 and are consistent with the other figures.
