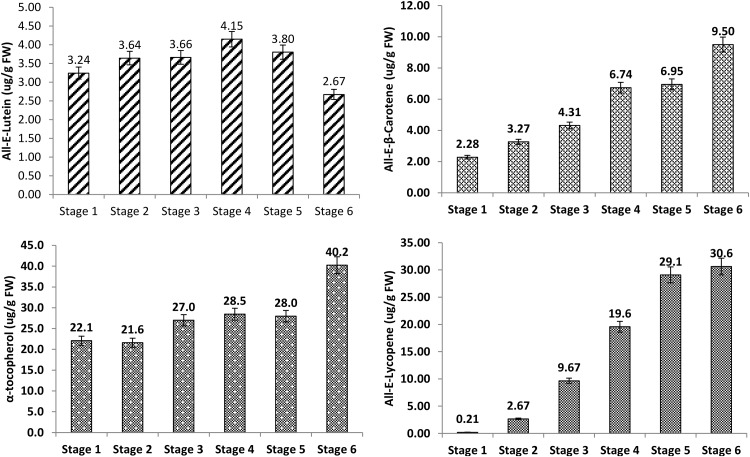
Fig. 2.
The content of all-E-lutein, all-E-β-carotene, all-E-lycopene, and α-tocopherol in tomato fruits of different ripening stages. Values above bars displaying the data labels. Values are mean ± standard deviation from six replicates (triplicate extractions with duplicate analysis). Different superscript letters indicate statistically significant differences among the various ripening stages (p < 0.05)

