Fig. 1.
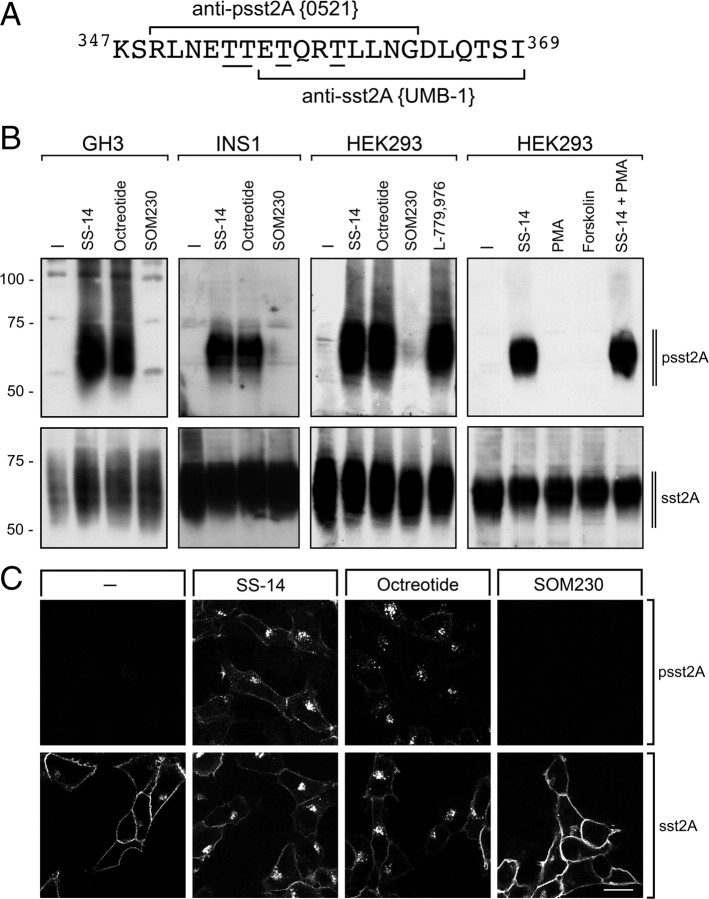
Agonist-selective phosphorylation and internalization of the sst2A receptor in vitro. A, Carboxyl-terminal amino acids of sst2A are depicted. Peptides used for immunization of rabbits are marked for anti-psst2A (0521) and anti-sst2A (UMB-1). The underlined phosphate acceptor sites were phosphorylated for generation of anti-psst2A. B, Rat pituitary GH3 cells were transiently transfected with the rat sst2A receptor. Cells were either not exposed or exposed to 1 μm SS-14, 1 μm octreotide, or 10 μm SOM230 for 5 min (left panel). B, Pancreatic insulinoma INS1 cells which endogenously express the rat sst2A receptor were either not exposed or exposed to 1 μm SS-14, 1 μm octreotide, or 10 μm SOM230 for 5 min (second panel). B, HEK293 cells stably expressing the rat sst2A receptor were either not exposed or exposed to 1 μm SS-14, 1 μm octreotide, 10 μm SOM230, 1 μm L-779,976, 100 nm PMA, 10 μm forskolin, or 1 μm SS-14 and 100 nm PMA for 5 min (third and fourth panels). The levels of phosphorylated sst2A receptors (upper panel) and total sst2A receptors (lower panel) were then determined by Western blot analysis. The Western blots shown are representative for two to three independent experiments each. The positions of the molecular mass markers are indicated on the left (in kilodaltons). C, HEK293 cells stably expressing the rat sst2A receptor were exposed to 1 μm SS-14, 1 μm octreotide, or 10 μm SOM230 for 5 min. Cells were then fixed and incubated with anti-psst2A (upper panel) or anti-sst2A (lower panel), processed for immunofluorescence, and examined by confocal microscopy. Shown are representative images from one of five independent experiments performed in duplicate. Scale bar, 20 μm.

