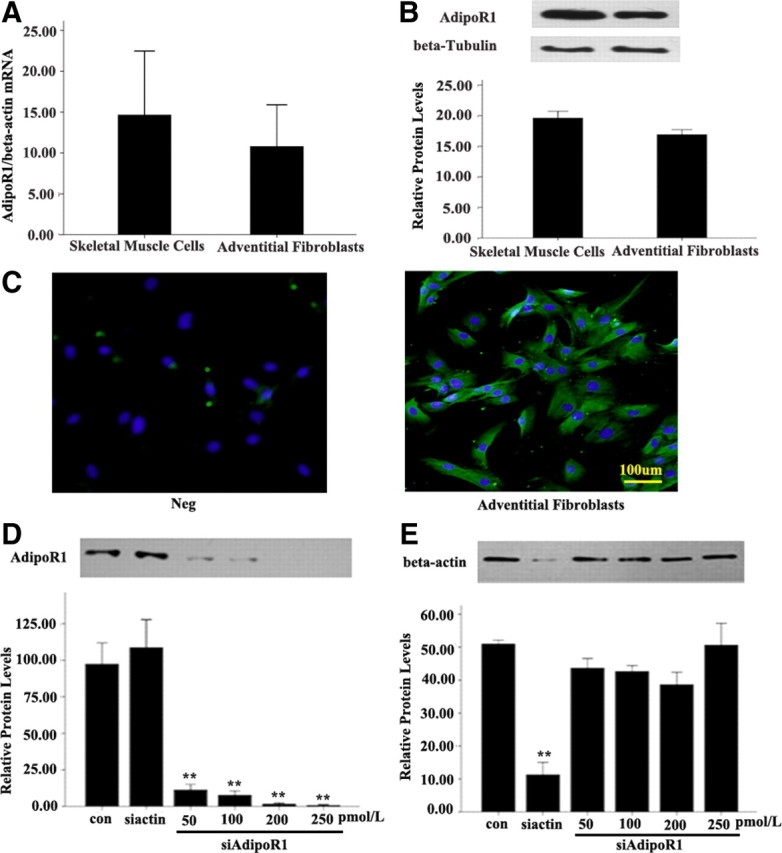
Fig. 3.

Expression of AdipoR1 in normal AFs and skeletal muscle cells and effect of siAdipoR1. A, AdipoR1 mRNA expression levels normalized to that of β-actin mRNA expression. P > 0.05 vs. skeletal muscle cells. B, AdipoR1 protein expression. Expression of β-tubulin band was used as a loading control. P > 0.05 vs. skeletal muscle cells. C, Immunofluorescent staining of mouse AFs with antibody to AdipoR1. Neg, negative control; Green, FIFC staining; Blue, DAPI staining. D, The siRNA restrained only siAdipoR1, which shows that its knockdown effect was specific, and the knockdown effect of siAdipoR1 was increased in a dose-dependent manner. N, transfection of irrelevant siRNA; siβ-actin, transfection of siRNA of β-actin (100 pm); siAdipoR1, transfection of siRNA of AdipoR1 in different doses. **, P < 0.01 vs. control (con). Values are means ± sem.
