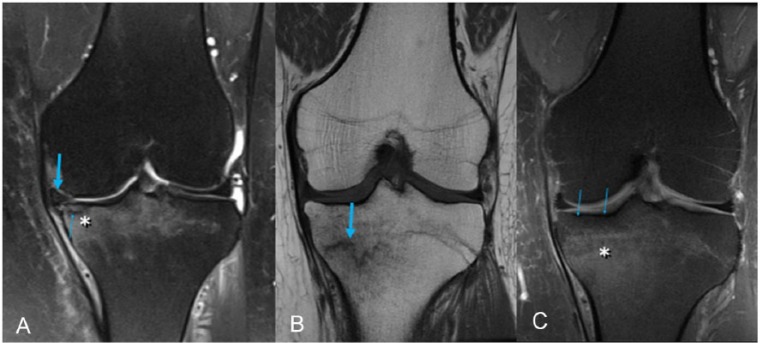
Figure 4.
(A) Typical subchondral fracture in the load-bearing area of the medial tibial plateau. Edema (asterisk) extends into the subchondral cortical bone. This image further shows the subchondral fracture line (arrow) and medial meniscus extrusion (thick arrow). (B) and (C) Typical fatigue stress fracture. Notably, edema (asterisk) does not extend into the subchondral cortical bone (arrows) because the meniscus-cartilage-subchondral bone unit is preserved. The incomplete fracture line is better characterized on T1-weighted imaging (thick arrow).

