
Figure 4.
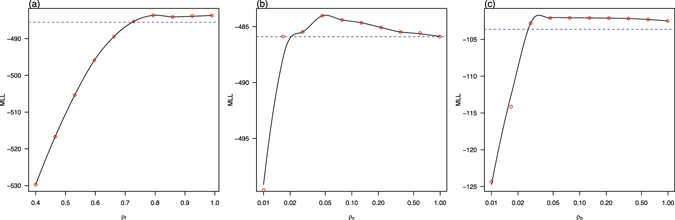
Maximum log-likelihood (MLL) as a function of reporting ratio ρ for (a) French Polynesia, ρ f; (b) Colombia, ρ c; and (c) the State of Bahia in Brazil, ρ b, respectively. The red circles denote the estimated MLL at the given value of the control parameter. The black curves denote Local Polynomial Regression Fittings with a span of 0.5. The blue dotted lines indicate the thresholds of − from the maximum of the MLL. The maximum value of the black curve gives the maximum log-likelihood estimate of the control parameter, while the intersections of the two curves yield the 95% CI.