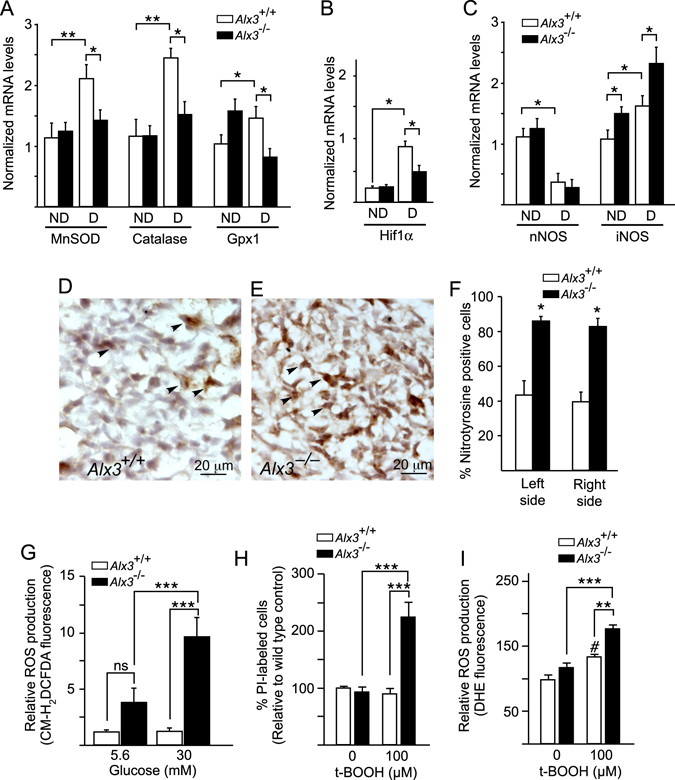
Figure 3.

Impaired activation of genes encoding oxidative stress-scavenging enzymes and increased oxidative stress in Alx3-deficient embryos developing during diabetic pregnancies. (A–C) Relative levels of mRNA extracted from embryos of non-diabetic (ND) or diabetic (D) wild type (white bars) or Alx3-deficient (black bars) mice, as assessed by quantitative RT-PCR after 10.5 days of gestation. Shown are mRNAs encoding manganese superoxide dismutase (MnSOD), catalase and glutathione peroxidase-1 (Gpx1) (A), Hif1α (B) or neuronal (n) or inducible (i) nitric oxide synthase (NOS) (C). *P < 0.05; **P < 0.01; Student’s t-test (n = 7 per group). (D and E) Representative sections showing nitrotyrosine immunohistochemistry in the head mesenchyme of Alx3 +/+ (D) or Alx3 −/− (E) embryos from diabetic pregnancies. Arrowheads indicate representative examples of nitrotyrosine-positive cells. (F) Quantification of the percentage of nitrotyrosine-positive cells detected by immunohistochemistry in sections from wild type (white columns) or Alx3-deficient (black columns) embryos from diabetic pregnancies. Equivalent mesenchyme regions symmetrically located at both left and right sides of each section relative to the midline of the embryo were scored independently. Approximately 1000 cells per section from 6 sections obtained from 3 embryos in each group were counted. *P < 0.001, Student’s t-test. (G) Quantitation of ROS in control (white bars) or Alx3-deficient (black bars) primary MEM cells cultured in the presence of the indicated concentrations of glucose and labelled with the fluorescent dye CM-H2DCFDA (n = 6 per group). (H and I) Response of control or Alx3-deficient primary MEM cells to t-BOOH treatment. In H, the relative numbers of non-viable cells identified by propidium iodide (PI) staining is represented (n = 14 for untreated cell groups; n = 12 for t-BOOH-treated cell groups). In I, ROS production as measured by DHE fluorescence is shown (n = 7 for untreated cell groups; n = 6 for t-BOOH-treated cell groups). In (G–I), *P < 0.05; **P < 0.01; ***P < 0.001; # P < 0.05, compared with untreated wild type cells. ANOVA followed by Bonferroni test. All values represent mean s.e.m.
