Figure 5.

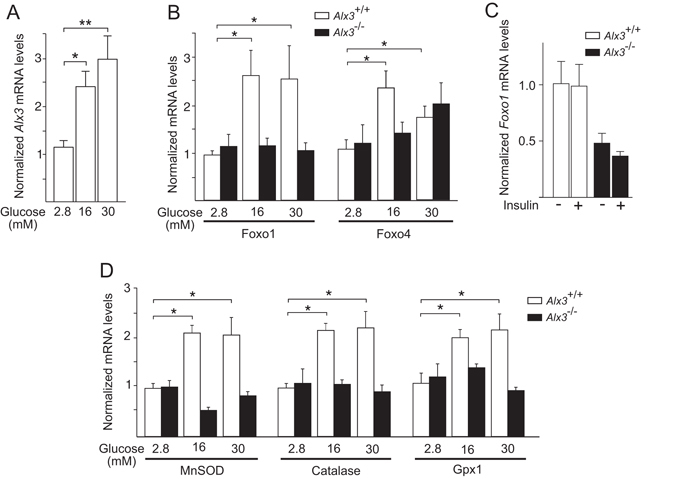
Impaired response to glucose in Alx3-deficient cells. (A) Relative levels of Alx3 mRNA in primary MEM cells obtained from wild type mice cultured in the presence of the indicated concentrations of glucose (n = 5). (B) Relative levels of Foxo1 and Foxo4 mRNA in primary MEM cells obtained from wild type (white bars) or Alx3-deficient (black bars) embryos cultured in the presence of the indicated glucose concentrations (n = 7 per group). (C) Relative levels of Foxo1 mRNA in primary MEM cells from wild type (white bars) or Alx3-deficient (black bars) embryos cultured in the presence of 0.5% FBS without (−) or with (+) insulin (100 nM) (n = 5 per group). (D) Relative levels of MnSOD, catalase and Gpx1 mRNA in primary MEM cells from wild type (white bars) or Alx3-deficient (black bars) embryos cultured in the indicated glucose concentrations (n = 7 per group). All data obtained by quantitative RT-PCR. In all cases, values represent mean s.e.m. *p < 0.05, **p < 0.01, Student’s t-test.
