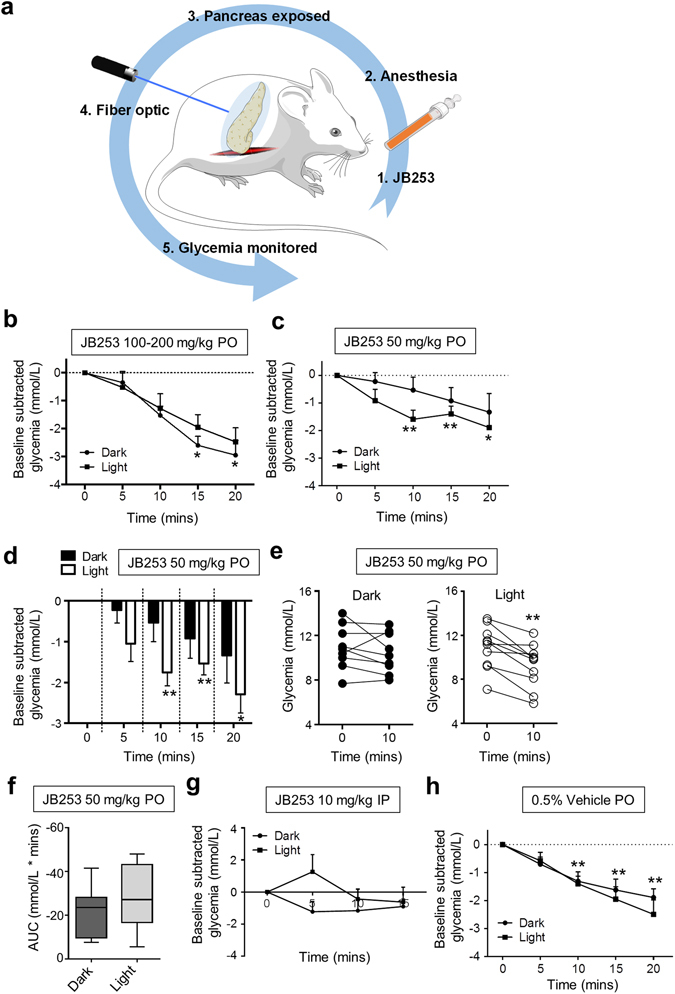
Figure 4.

Optical control of glucose homeostasis using JB253. (a) Schematic showing the experimental protocol for in vivo photopharmacology in mice (adapted from Servier Medical Art under a CC-BY licence) (https://creativecommons.org/licenses/by/3.0/). (b) JB253 100–200 mg/kg administered per os (PO) significantly decreases glycemia in the dark without evidence of photocontrol following illumination with a λ = 470 ± 5 nm (blue) laser (n = 4 animals per state). (c) JB253 50 mg/kg administered PO significantly lowers glycemia only during exposure to blue light (λ = 470 nm) (n = 9–10 animals per state). (d) As for (c), but bar graph to better show the differences between light/dark. (e) Before-and-after plot showing that all animals receiving JB253 50 mg/kg responded to light with decreases in glucose concentration (n = 9–10 animals per state). (f) Box and whisker plot showing area-under-the-curve (AUC) in JB253-treated animals under dark or light conditions. (g) Light does not significantly influence glycemia in mice injected intraperitoneally with 10 mg/kg JB253 (n = 3 animals per state). (h) As for (c), but showing lack of photocontrol in mice receiving vehicle-alone (0.5% CMC) PO (n = 9–10 animals per state). For multiple comparisons, *P < 0.05, **P < 0.01; repeated measures one-way ANOVA (Bonferroni’s posthoc test). For pairwise comparisons (e and f), **P < 0.01; paired Student’s t-test or Mann-Whitney U test. Data represent the mean + SEM (or median + range for Box and Whiskers plot).
