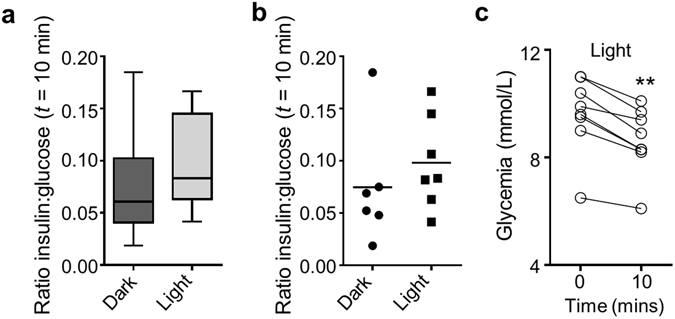
Figure 5.

JB253 and insulin secretion. (a) Box and whiskers plot showing that insulin secretion, normalized as the ratio insulin:glucose, tends to increase during illumination in JB253-treated animals (median and range shown). (b) As for (a), but scatter plot to show the presence of a single outlier (mean is shown). (c) Before-and-after plot showing that glucose concentrations decreased during illumination in all JB253-treated animals examined. **P < 0.01, paired Student’s t-test.
