
Figure 1.
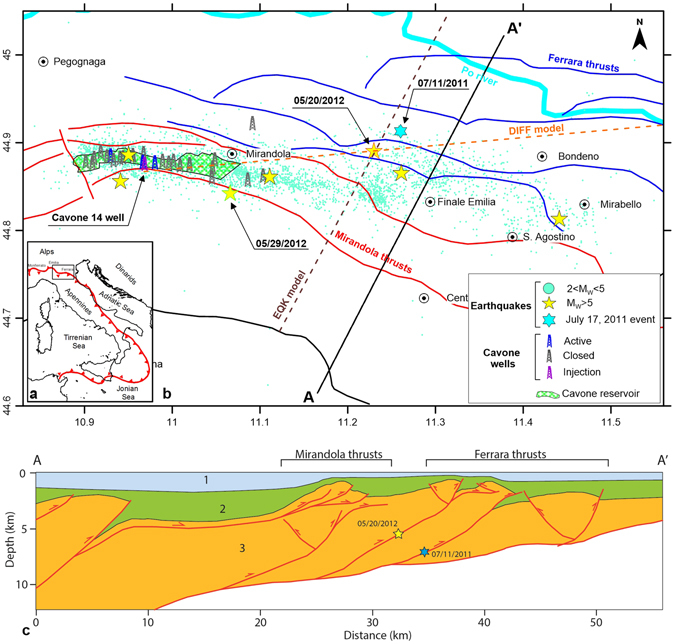
(a) Main thrust alignment in Italy. (b) Detailed map of the study area (black box in panel a). Location of the 2012 Emilia seismic sequence with respect to the Cavone oilfield and the production/injection wells. The yellow stars are earthquakes larger than ML > 5.0. The two mainshocks are represented by yellow stars with red (05/20/2012 event) and green (05/29/2012 event) outlines. The cyan star indicates the position of the July 17, 2011 event. The tectonic structures represent the main thrusts (continuous lines) and back-thrusts (dashed lines) of the Ferrara (blue), Mirandola (red) and Pede-Apennines (black) systems75. The orange and brown dashed lines represent the cross sections of the DIFF and EQK models, respectively. (c) Simplified geological cross-section of A-A’ in panel b. The units in this section are as follows: 1- Quaternary layer, 2- Pliocenic-Miocenic layer, and 3- Triassic-Lower Cretaceous layer. This figure was created with Surfer® from Golden Software, LLC (www.goldensoftware.com) and Adobe Illustrator (www.adobe.com).