
Figure 3.
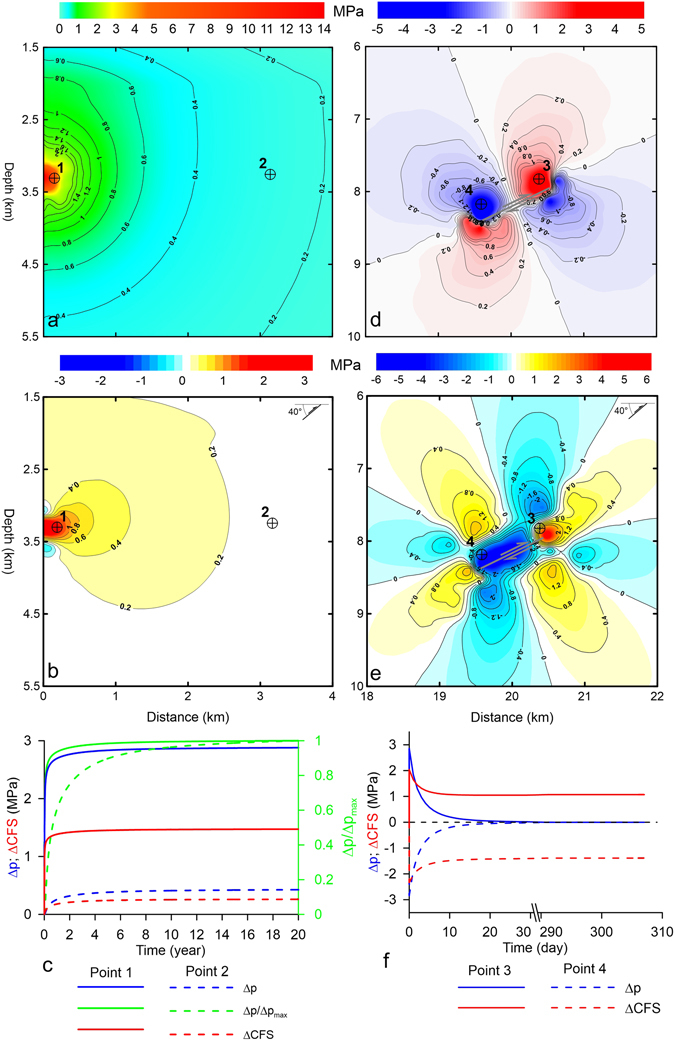
(a) Fluid overpressures after 20 years of injection at the Cavone 14 well (DIFF model; panel b in Fig. 2). (b) Coulomb stress changes after 20 years of injection at the Cavone 14 well. (c) Temporal evolution of the overpressures (Δp), overpressure ratio (Δp/Δpmax) and ΔCFS at points 1 and 2 in panels a and b. (d) Coseismic fluid overpressures and underpressures immediately after the simulated Mw 4.5 earthquake (EQK model; panel c in Fig. 2). (e) Coulomb stress changes ten months after the July 17, 2011 Mw 4.5 earthquake. (f) Temporal evolution of the overpressures (Δp) and ΔCFS at points 3 and 4 in panels d and e. The figures were created with Surfer® and Grapher® from Golden Software, LLC (www.goldensoftware.com). For context, the relative positions of the blown-up illustrations in (a), (b), (d) and (e) from Figs 3 and 4 are given in Supplementary Figures S5–S7.