
Figure 5.
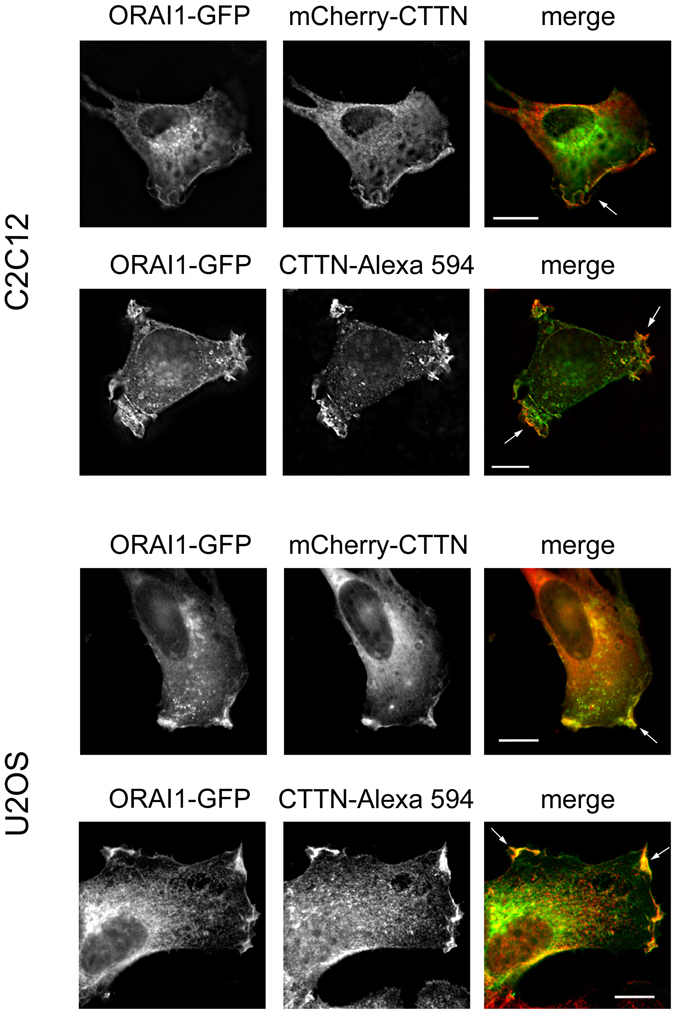
Co-localization of ORAI1 and CTTN. Top panels: C2C12 and U2OS were transfected for the transient transfection of ORAI1-GFP and mCherry-CTTN, and visualized under wide field epifluorescence microscopy. As in Fig. 2, C2C12 cells were stimulated with FBS (20%), and U2OS cells were stimulated with 50 ng/ml EGF for 10 min after 8–10 h of FBS-deprivation in RPMI medium. Images are representative of at least 6 independent experiments for every cell line. Bar = 10 μm. Bottom panels: ORAI1-GFP transfected cells were assessed for endogenous CTTN localization with a mouse monoclonal anti-cortactin antibody and anti-mouse IgG labelled with Alexa Fluor 594. Images are representative of at least 5 independent experiments for both cell lines. Bar = 10 μm.