
Figure 3.
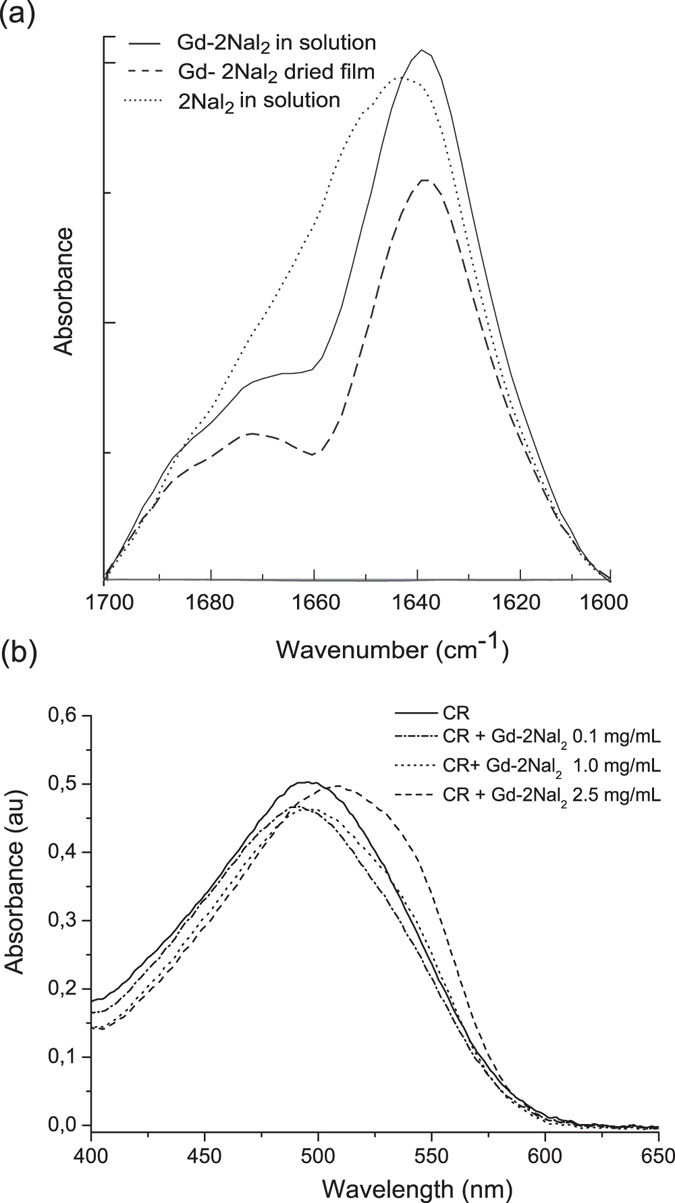
(a) FTIR spectra of 2Nal2 and Gd-2Nal2 in the amide I region at 5.0 mg/mL. (b) UV-Vis spectra of 2Nal2 and Gd-2Nal2, stained with Congo Red at 0.1 and 1.0 mg/mL. The spectrum of Congo Red is also reported for comparison.
Official websites use .gov
A
.gov website belongs to an official
government organization in the United States.
Secure .gov websites use HTTPS
A lock (
) or https:// means you've safely
connected to the .gov website. Share sensitive
information only on official, secure websites.
(a) FTIR spectra of 2Nal2 and Gd-2Nal2 in the amide I region at 5.0 mg/mL. (b) UV-Vis spectra of 2Nal2 and Gd-2Nal2, stained with Congo Red at 0.1 and 1.0 mg/mL. The spectrum of Congo Red is also reported for comparison.