
Figure 9.
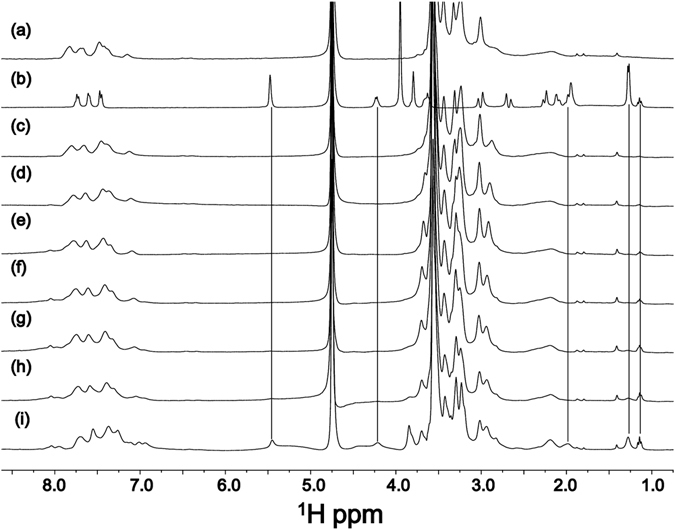
1D 1H NMR spectra acquired at 298 K of (a) La-(2-Nal)2 at 2.5 mg/mL, (b) DOX 0.5 mg/mL, (c) La-(2-Nal)2 at 2.5 mg/mL + DOX 0.05 mg/mL, (d) La-(2-Nal)2 at 2.5 mg/mL + DOX 0.1 mg/mL, (e) La-(2-Nal)2 at 2.5 mg/mL + DOX 0.2 mg/mL, (f) La-(2-Nal)2 at 2.5 mg/mL + DOX 0.3 mg/mL, (g) La-(2-Nal)2 at 2.5 mg/mL + DOX 0.4 mg/mL, (h) La-(2-Nal)2 at 2.5 mg/mL + DOX 0.5 mg/mL, (i) La-(2-Nal)2 at 2.5 mg/mL + DOX 1 mg/mL. In the lowest spectrum a few peaks arising from doxorubicin appear, as indicated by the black lines.