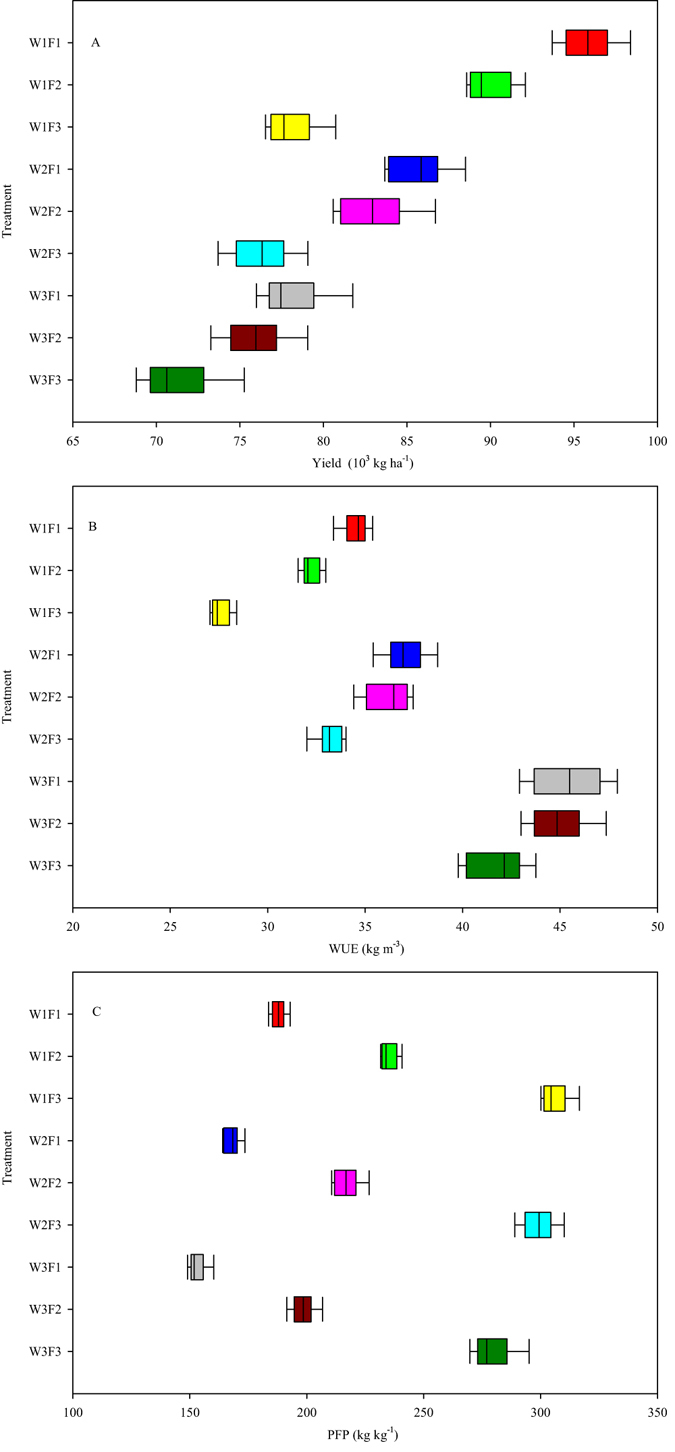
Figure 1.

Effects of irrigation and fertilization treatments on fruit yield (A), water use efficiency (WUE) (B) and partial factor productivity (PFP) (C) in three consecutive growing seasons in 2012−2013. The treatments are noted as W1, 100% ET 0; W2, 75% ET 0; W3, 50% ET 0; F1, N240−P2O5120−K2O150 kg ha−1; F2, N180−P2O590−K2O112.5 kg ha−1; and F3, N120−P2O560−K2O75 kg ha−1. Boxes show the 25th and 75th percentiles. Lines in the boxes show the median values. Data are the means of nine replicates: three growing seasons and three replications per treatment.
