
Figure 6.
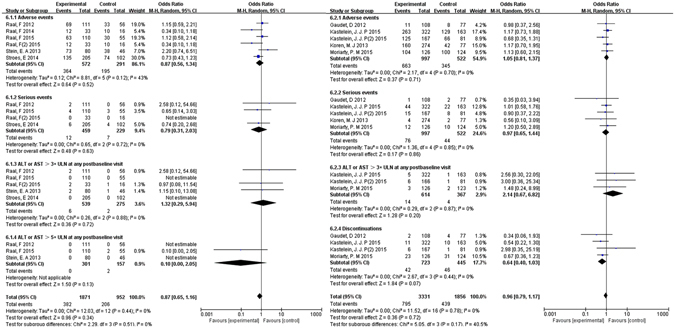
Forest plot depicting the adverse event rates following (a) evolocumab and (b) alirocumab therapies, compared with placebo or ezetimibe controls on adverse events, serious events and ALT or AST rates.
Official websites use .gov
A
.gov website belongs to an official
government organization in the United States.
Secure .gov websites use HTTPS
A lock (
) or https:// means you've safely
connected to the .gov website. Share sensitive
information only on official, secure websites.
Forest plot depicting the adverse event rates following (a) evolocumab and (b) alirocumab therapies, compared with placebo or ezetimibe controls on adverse events, serious events and ALT or AST rates.