
Figure 4.
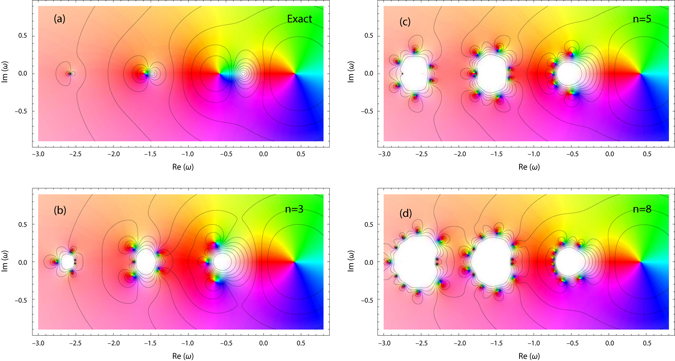
Electron Green’s function g(ω) resolved in complex plane for Ω = 1 and γ = 0.65. Approximations are computed using SE of orders 3 (b), 5 (c), and 8 (d) and compared to the exact solution (a). For g(ω), the hue channel represents the arg[g(ω)], the saturation channel represents the modulus |g(ω)|, and the contour plot depicts tanh |g(ω)|.