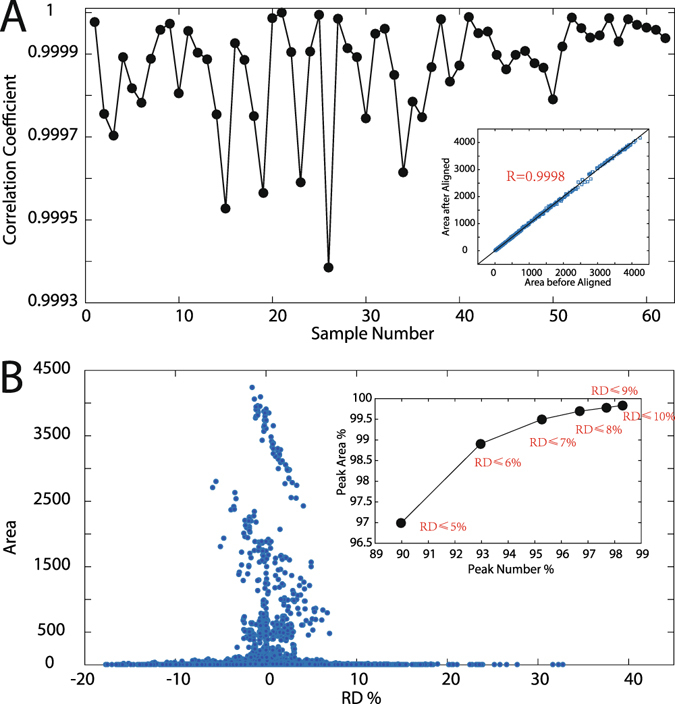
Figure 5.

(A) Correlation coefficients calculated based on peak area of original and time-shift alignment chromatograms. (B) Relative area deviation (RD%) vs area. Inserted plot in (A) shows the relationship between original chromatographic areas and those after time-shift alignment. Inserted plot in (B) shows statistical parameter under various RD%. For instance, the marker RD% of 5%, the x axis indicated that 95% peaks with RD% is no more than 5%, and the value in y axis indicate that their area is 97% of the total area. RD% = (Areaaligned − Areaoriginal)/Areaoriginal × 100%.
