Figure 3.

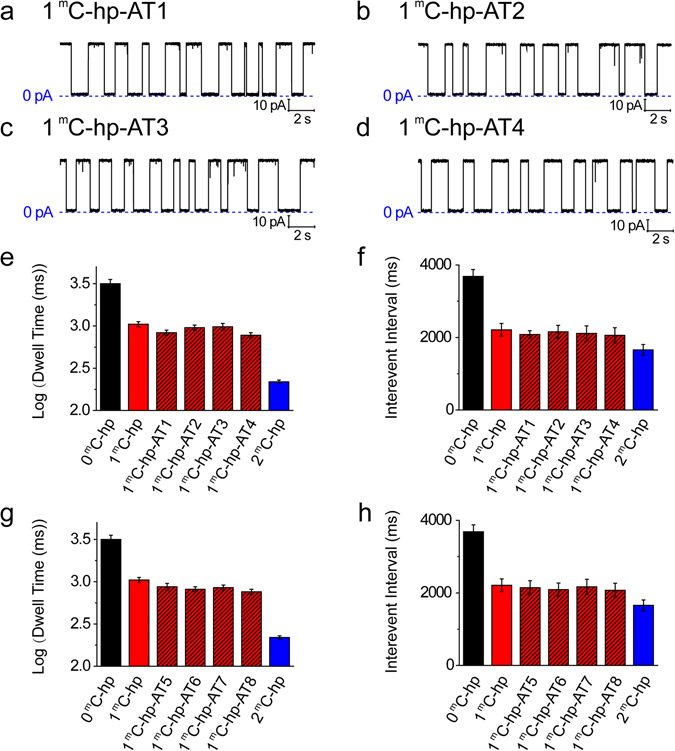
Effect of sequence context on distinguishing DNA methylation. (a–d) Current traces for 1 mC-hp-AT1 (a), 1 mC-hp-AT2 (b), 1 mC-hp-AT3 (c), and 1 mC-hp-AT4 (d) in 4 M TMA-Cl. (e,f) The peak value of dwell time (n = 4) in log-form histograms (e) and mean interevent interval (n = 4) of DNA hairpin translocation events (f) for 0 mC-hp, 1 mC-hp, 1 mC-hp-AT1, 1 mC-hp-AT2, 1 mC-hp-AT3, 1 mC-hp-AT4 and 2 mC-hp. (g,h) The peak values of dwell time (n = 4) values in log form (g) and mean interevent interval (n = 4) values (h) for replaced 1 mC-hps (1 mC-hp-AT5, 1 mC-hp-AT6, 1 mC-hp-AT7 and 1 mC-hp-AT8). The mean dwell times and mean interevent intervals were from single-channel recording, and signals were filtered at 2 kHz and sampled at 20 kHz. DNA (0.3 µM) was added into the cis chamber. The buffer was 10 mM Tris-HCl (pH 8.5).
