
Figure 3.
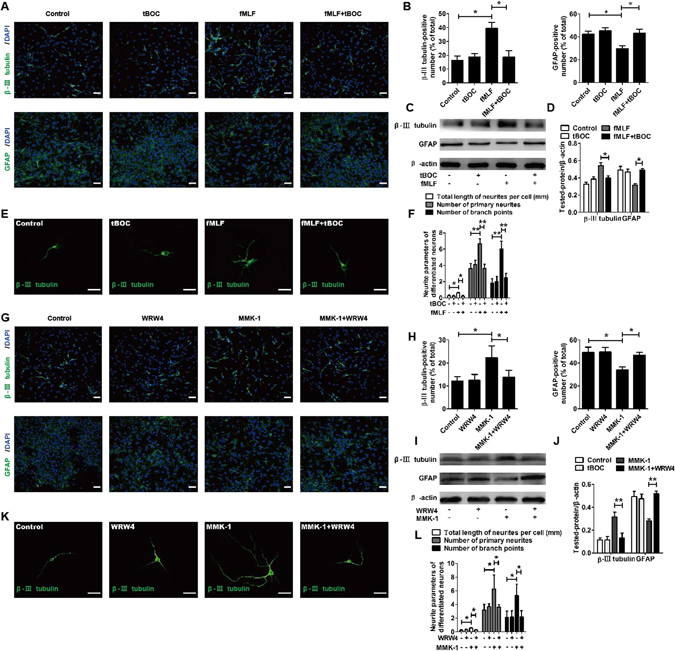
Promoting effects of Fprs on neuronal differentiation of NSCs were blocked by FPRs antagonist. (A–F) Promoting effects of Fpr1 on neuronal differentiation of NSCs were blocked by FPR1 antagonist. (A,B) Dissociated NSCs were differentiated for 6 days with or without preadministering tBOC, an FPR1 inhibitor, for 30 min before administering fMLF. The differentiated cells were then identified by immunocytochemistry using antibodies against β-III tubulin and GFAP. The images in (A) are representative of several independent experiments, and the graph in (B) shows the statistical results. (C) Representative immunoblots. (D) Histograms showing relative levels of β-III tubulin and GFAP. (E) Dissociated NSCs were differentiated in an extremely low density (1000 cells/mL), and then the cells were immunostained with β-III tubulin. (F) Quantified analysis of total length of neurites per cell, the number of primary neurites, and the number of branch points. (G–L) Promoting effects of Fpr2 on neuronal differentiation of NSCs were blocked by FPR2 antagonist. (G,H) Dissociated NSCs were differentiated for 6 days with or without preadministering WRW4, an FPR2 inhibitor, for 30 min before administering MMK-1. The images in (G) are representative of several independent experiments, and the graph in (H) shows the statistical results. (I) Representative immunoblots. (J) Histograms showing relative levels of β-III tubulin and GFAP. (K) Representative micrographs of the differentiated cells immunostained with β-III tubulin. (L) Quantified analysis of total length of neurites per cell, the number of primary neurites, and the number of branch points. Data were presented as mean ± SEM. *P < 0.05; **P < 0.01; N = 4. Scale bar = 20 µm.