
Figure 8.
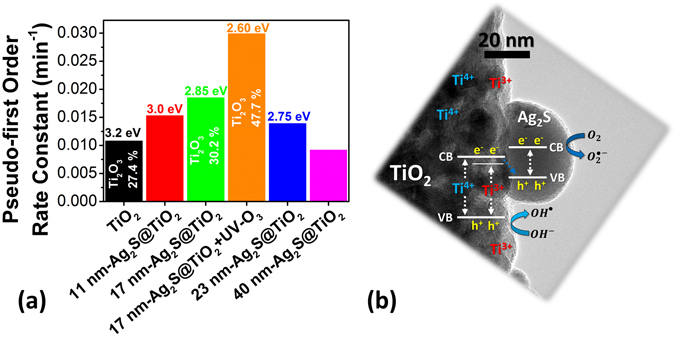
(a) Methylene blue photodegradation rate constants for all the samples. Percentage of Ti2O3 surface states (estimated form O 1 s XPS signal) and calculated bandgaps are also listed. (b) Schematic of the interfacial charge transfer processes during illumination of Ag2S sensitized TiO2 nanofibers with excess Ti3+ states and oxygen vacancies.