
Figure 5.
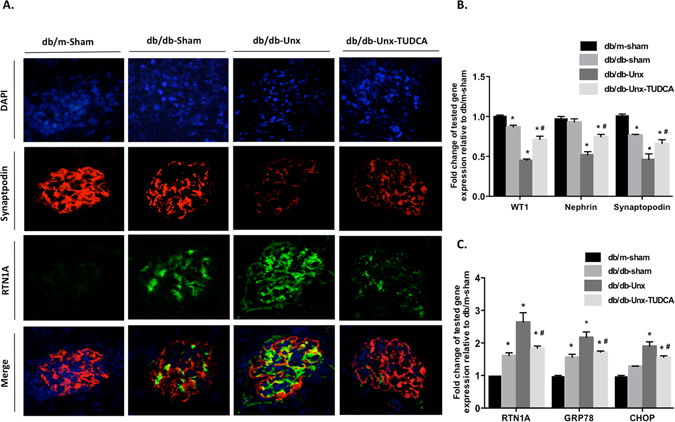
RTN1A expression in podocytes was highly associated with ER stress and podocyte injury in the glomeruli of diabetic mice. (A) Immunofluorescent staining (magnification ×400) illustrates RTN1A (green) and synaptopodin (red) co-staining in kidney sections. (B) Gene expressien of podocyte markers by real-time PCR analysis of glomeruli from mice in different groups (C) Gene expression of RTN1A and ER stress markers by real-time PCR analysis of glomeruli from mice in different groups. Values are expressed as means ± SEM. *P < 0.05 compared with db/m-sham mice, #P < 0.05, compared with db/db-Unx mice, n = 5.