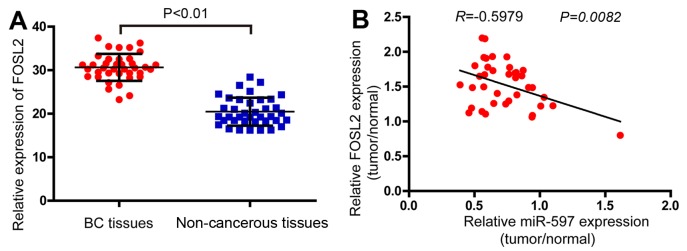
Figure 6.
The correlations between FOSL2 and miR-597 in breast cancer tissues and normal breast tissues. (A) FOSL2 expression levels were detected by qRT-PCR in 38 tumor samples and pair-matched adjacent non-cancerous tissues using the 18S ribosome as an internal reference; P<0.01. (B) The negative correlation between the expression of miR-597 and FOSL2 in 38 patient samples with breast carcinoma (r=−0.5979, P=0.0082). The relative expression of miR-597 and FOSL2 was quantified using qRT-PCR, normalized to U6 or 18S and analyzed with the Pearson correlation. For comparisons, a two-tailed, unpaired t-test was used.

