
Figure 2.
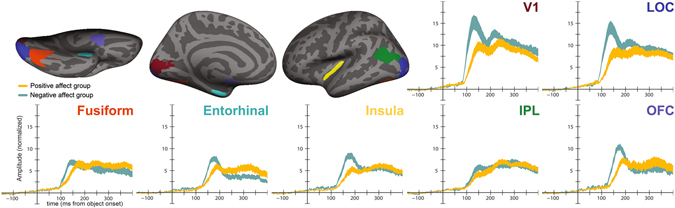
Regions of interest and average stimulus-evoked responses. Top-left: ventral, medial, and lateral views of the left hemisphere of an inflated brain showing a representative set of ROI labels. Note that we generated anatomically-constrained, functionally-defined ROIs for each individual participant. Surround: mean stimulus-evoked responses extracted from each region of interest and averaged across hemispheres (with SEM range shaded). Maroon = V1, blue = lateral occipital complex, orange = fusiform cortex, teal = entorhinal cortex, yellow = insula, green = inferior parietal lobule, purple = OFC. Shaded region indicates standard error of the mean.