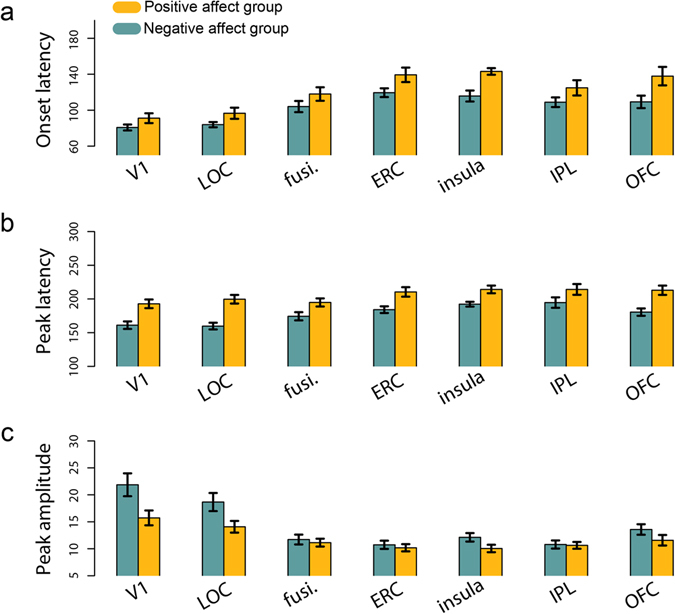
Figure 3.

Differences in evoked response latency and amplitude between affect groups. (a) Mean onset latency (b) mean peak latency and (c) mean amplitude across regions of interest, broken down by negative and positive affect group. LOC = lateral occipital complex, fusi. = fusiform cortex, ERC = entorhinal cortex, IPL = inferior parietal lobule, OFC = orbitofrontal cortex. Error bars indicate standard error of the mean.
