Figure 2.
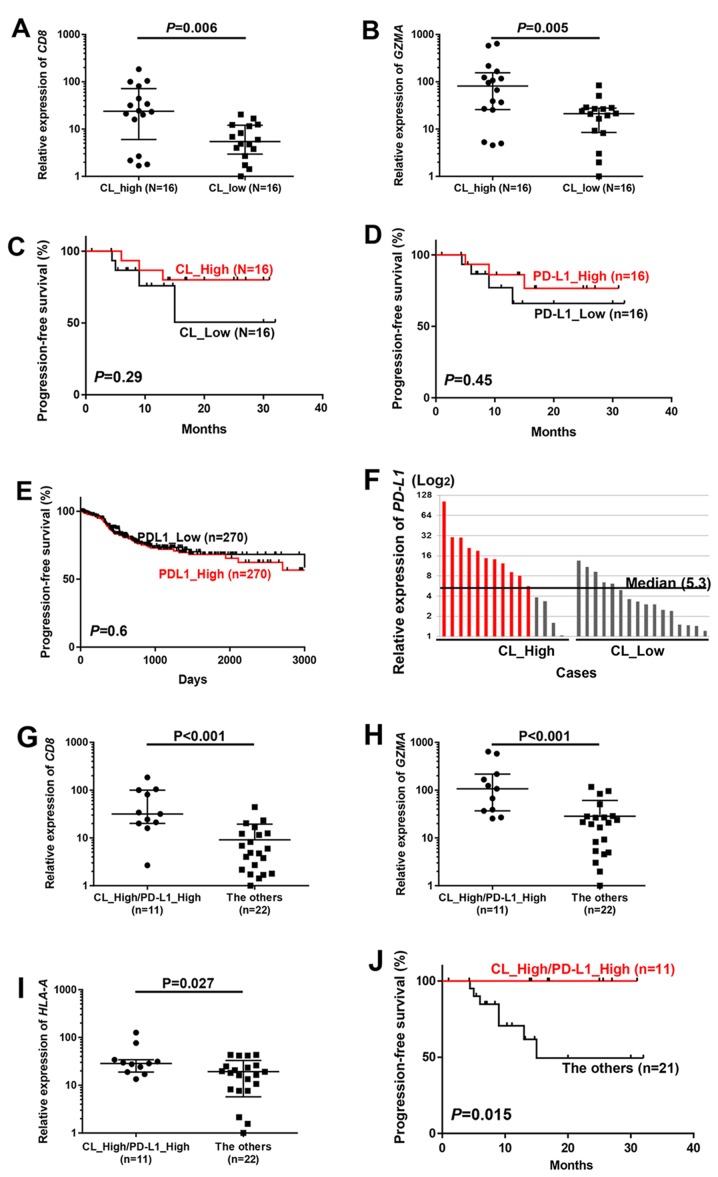
Favorable prognosis in cases with enriched TCRβ clonotypes and high PD-L1 mRNA expression. (A and B) All 32 cases were classified into two groups by the median number of TCRβ clones with >0.1% frequency (Materials and methods), and compared by mRNA expression of (A) CD8 and (B) GZMA. (C-E) Kaplan-Meier curves of progression-free survival for two groups classified by T cell clonal expansion in our 32 cases (C) and PD-L1 expression in our 32 cases (D) and PD-L1 expression in 540 TCGA cases (E) were evaluated by a log-rank test. Cases were classified by the median of each value. (F) All cases were classified into two groups according to high or low TCRβ clonality by the median value of numbers of TCRβ clones with the frequency of >0.1% (Materials and methods), and then individual cases in each group were ordered in the relative PD-L1 expression levels (median, 5.3). (G-I) Comparison of mRNA expression of (G) CD8, (H) GZMA and (I) HLA-A between ‘CL_High/PD-L1_High’ [cases shown in red in (F)] cases and ‘The others’. P-values were calculated by Mann-Whitney test. (J) Kaplan-Meier curves (progression-free survival) of patients by classification of tumors with T cell clonal expansion along with high PD-L1 expression (CL_High/PD-L1_High) and the other cases (The others). P-value was calculated using log-rank test.

