
Figure 3.
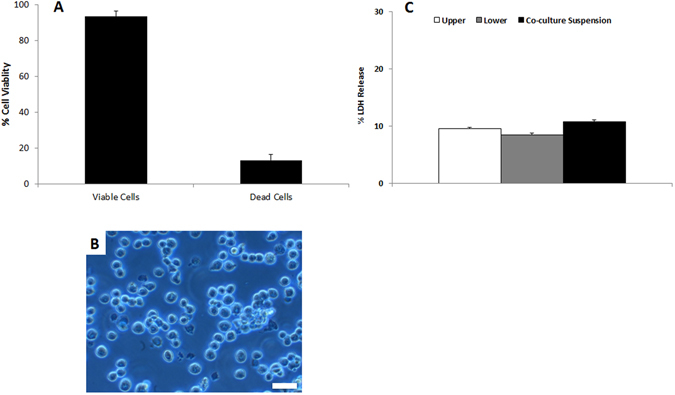
Viability based analytics of the multi-cell suspension. (A) Shows the percentage viability of the multi-cell suspension following the Trypsin-EDTA treatment as determined by the Trypan blue assay. (B) Shows a representative, 2D light microscopy image of the cell suspension. (C) Shows the percentage lactate dehydrogenase (LDH) release of the co-culture when attached to a membrane insert, as well as when in suspension. Specifically, the cell supernatant of the apical (upper) and basolateral (lower) compartments of the co-culture on a micro-porous insert membrane were analysed separately. These data sets were then compared to the cell supernatant of the multi-cell suspension following light centrifugation. In (A and C), data is expressed is the mean ± standard error of the mean (SEM) (n = 3). In (B), the scale bar represents 20 µm.