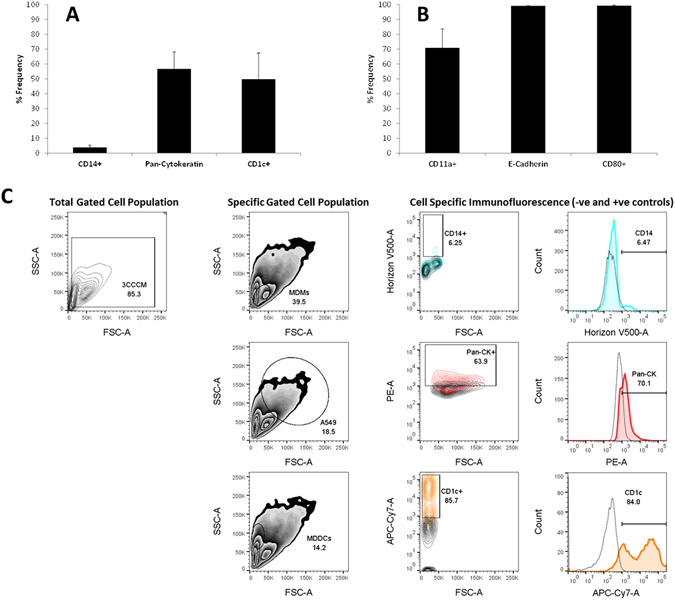
Figure 4.

Percentage frequency (%Frequency) of specific surface marker expression upon human blood monocyte derived macrophages (MDM) and dendritic cells (MDDC), as well as A549 epithelial cells when present in the multi-cell model suspension culture. In (A) CD14, Pan-Cytokeratin (A549 epithelial cells) and CD1c and (B) CD11a (MDM), E-Cadherin (A549 epithelial cells), CD80 (MDDC) show the average %Frequency for the antibody master-mix used (please refer to SI Table 1 for all antibody information). Data was obtained after implementing the specific gating strategy for the co-culture suspension (SI Fig. 1B) (C). Samples were analysed via three-colour flow cytometry (FACS). All data was analysed using FlowJo (Version 10, TreeStar, USA). In (A and B) all data expressed is the mean ± standard error of the mean (SEM) of the %Frequency. Experimentation was repeated on three separate occasions in triplicate (n = 3).
