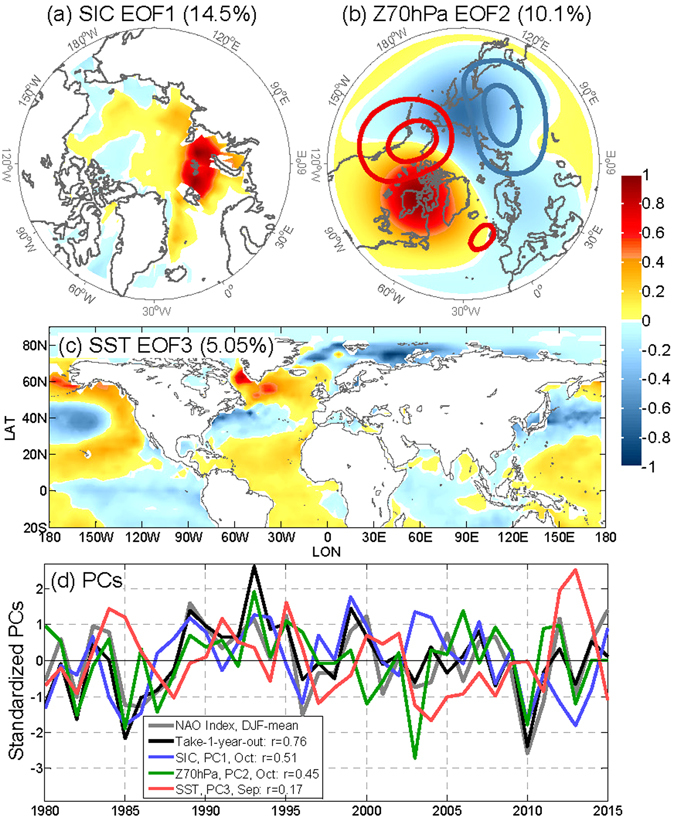
Figure 2.

EOF patterns (in normalized units) of (a) the first mode of SIC, (b) the second mode of Z70 hPa, and (c) the third mode of SST, for months from September to February (SONDJF). (d) Standardized PCs compared with the observed and predicted DJF-mean NAO index (the numbers represent their ACCs). The numbers in the titles of (a–c) represent the portion of the variance explained by each mode. The climatological mean zonally asymmetric geopotential height is plotted in (b) as contours with 1000 m interval (positive/negative values in red/blue, respectively). The maps were generated by MathWorks MATLAB R2013b with M_Map (http://www.eos.ubc.ca/~rich/map.html).
