
Figure 5.
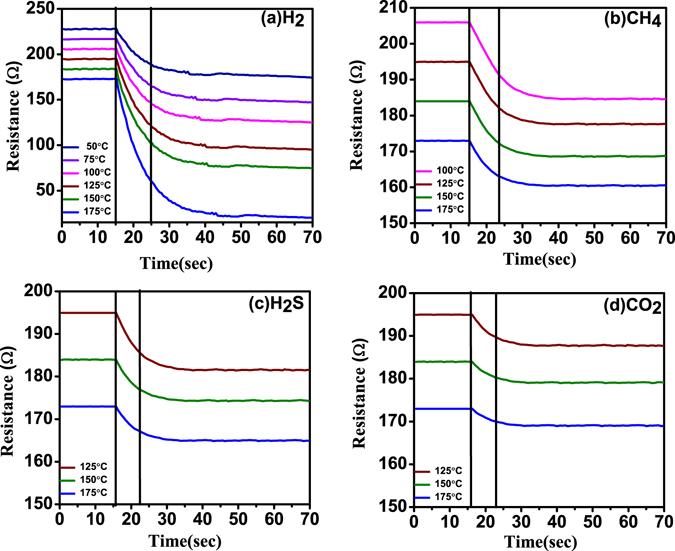
Resistance verses time curve for (a) H2, (b) CH4, (c) H2S and (d) CO2 gases with 1% concentration at various temperatures.
Official websites use .gov
A
.gov website belongs to an official
government organization in the United States.
Secure .gov websites use HTTPS
A lock (
) or https:// means you've safely
connected to the .gov website. Share sensitive
information only on official, secure websites.
Resistance verses time curve for (a) H2, (b) CH4, (c) H2S and (d) CO2 gases with 1% concentration at various temperatures.