
Figure 6.
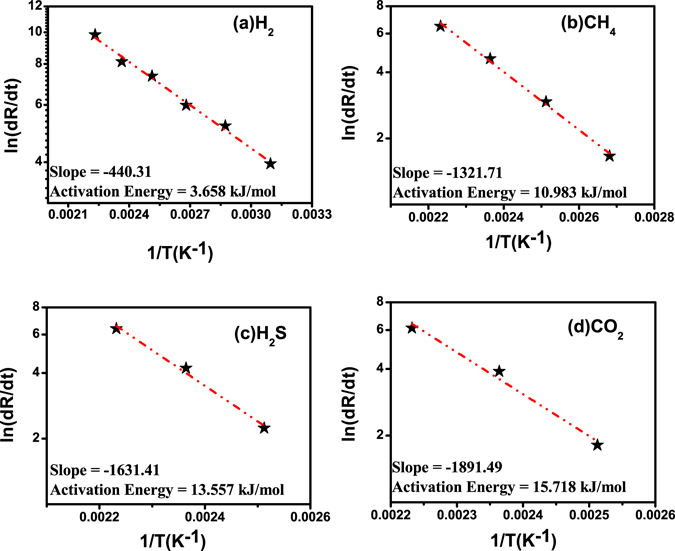
Arrhenius plot of rate of resistance change with temperature after exposure of 1% concentration of (a) H2, (b) CH4, (c) H2S and (d) CO2 gases.
Official websites use .gov
A
.gov website belongs to an official
government organization in the United States.
Secure .gov websites use HTTPS
A lock (
) or https:// means you've safely
connected to the .gov website. Share sensitive
information only on official, secure websites.
Arrhenius plot of rate of resistance change with temperature after exposure of 1% concentration of (a) H2, (b) CH4, (c) H2S and (d) CO2 gases.