
Figure 6.
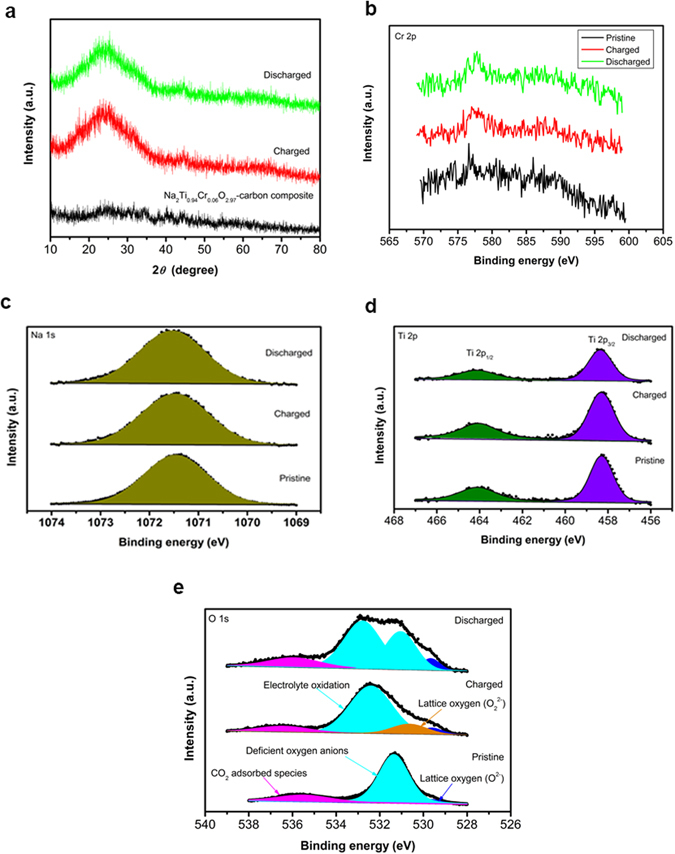
Analysis of the electrochemical desodiation and sodiation of Na2Ti0.94Cr0.06O2.97. (a) XRD patterns for the Na2Ti0.94Cr0.06O2.97-carbon composite, pristine electrode, fully charged sample, and discharged to 1.5 V under a current density of 18.9 mA g−1. XPS spectra of the Na2Ti0.94Cr0.06O2.97 electrodes, the spectra collected for pristine sample, fully charged sample and discharged to 1.5 V as well as by least-squares-fits using a software of XPSPEAK41. (b) Cr 2p spectra. (c) Na 1 s spectra. (d) Ti 2p spectra. (e) O 1 s spectra.