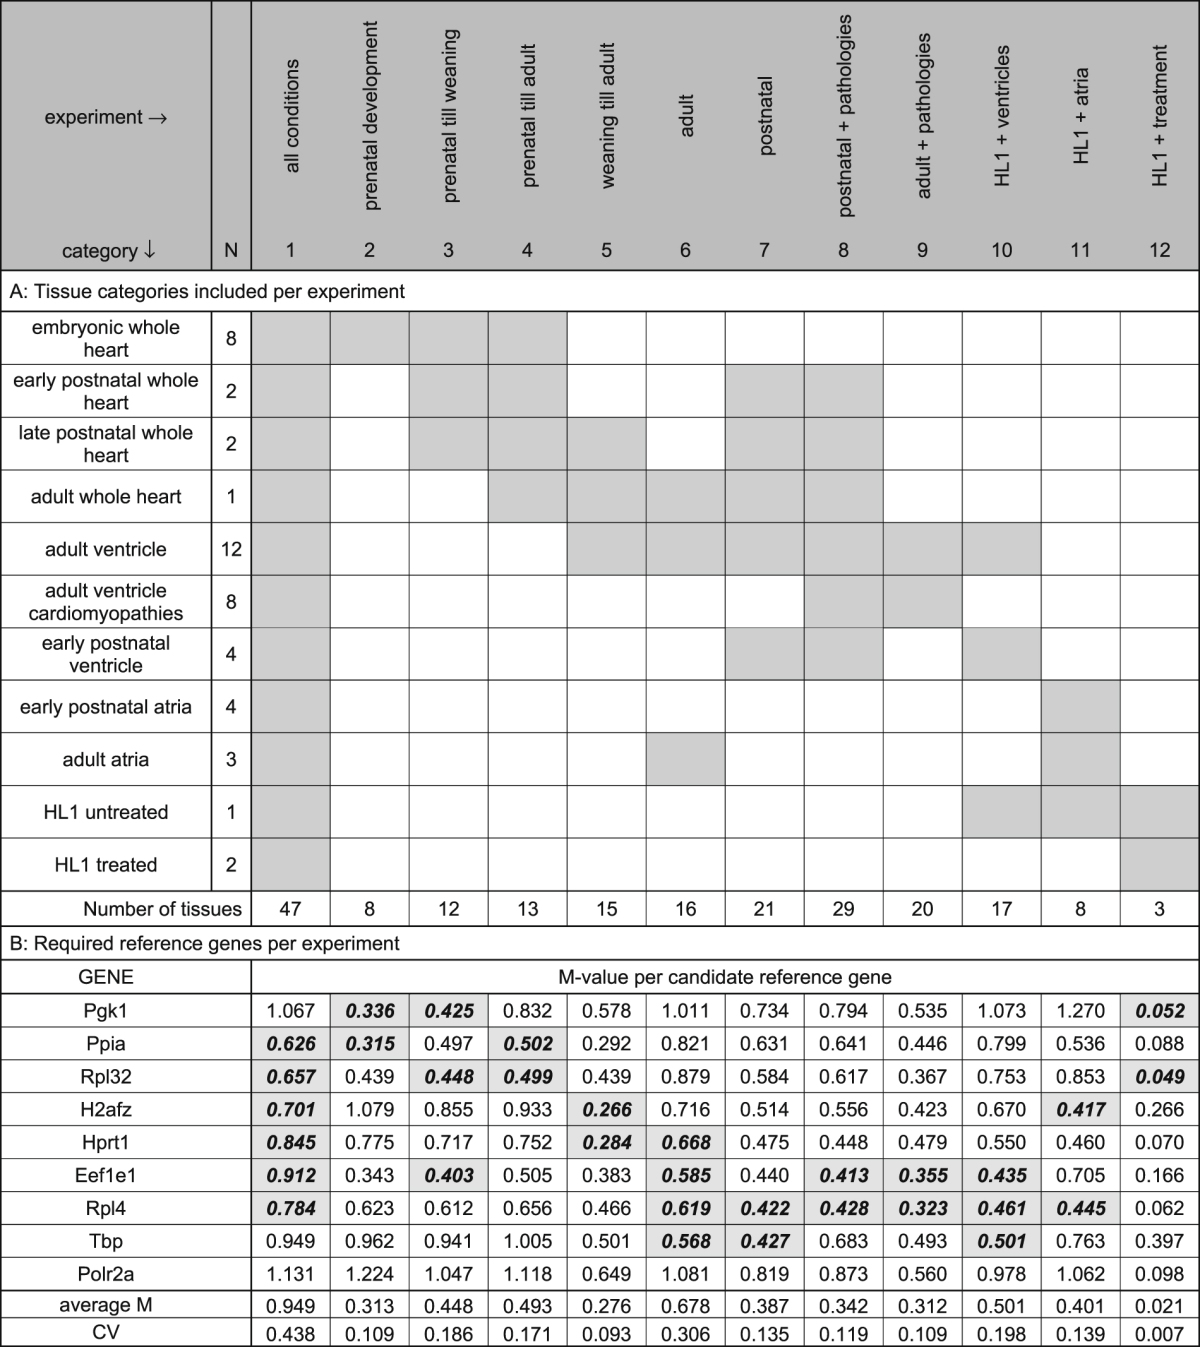
Table 1.
A. Grouping of categories of tissue types (rows) into experimental conditions (columns). Per category the number of included tissue types (N) are given. B. The reference genes required for normalization per experimental condition are indicated in gray; the M-values indicate the stability of the individual candidate reference genes in the experimental conditions. The average M-value and coefficient of variation (CV) are given for the required reference genes per experiment. See Supplemental Table 1 for an overview of the tissue samples included in each category of tissue types.