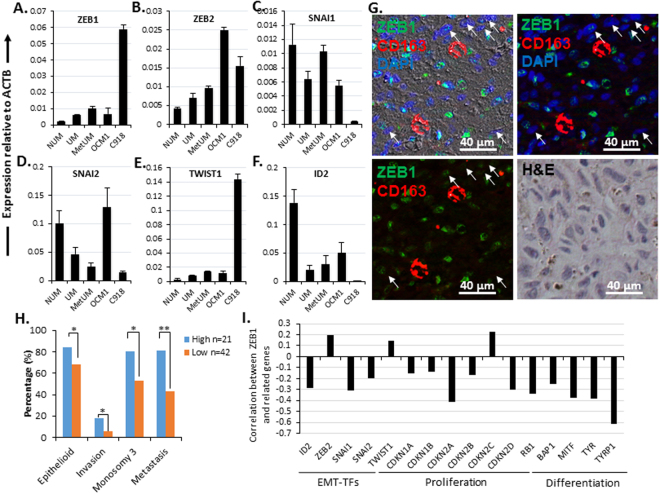
Figure 2.
Expression of EMT-TFs in human NUM, UM, MetUM, OCM1 and C918 cells. Transcriptional levels of EMT-TFs were examined in NUM, UM, MetUM by microarrays20, 21, and in OCM1, and C918 by qPCR. The expression levels of individual genes were normalized to that of the house-keeping gene β-actin (ACTB). (A) ZEB1; (B) ZEB2; (C) SNAI1; (D) SNAI2; (E) TWIST1; (F) ID2. (G) A representative patient UM of mixed phenotype showing ZEB1-stained nuclei are not elongated spindle shape and a few CD163 positive but ZEB1 negative thereby potential macrophages are scattered in the tumor. Arrows indicate elongated spindle nuclei which are ZEB1 negative and an H&E-stained section of the same area is included to show the mixed phenotype. (H) Statistical analyses of a large cohort of total 63 primary UMs (GES22138, Supplemental Table 4) on a number of selected tumor malignant properties in relation to their ZEB1 expression levels. After sorted from high to low expression of ZEB1, based on preliminary assessment we assign the top one third of the UMs as ZEB1 high (n = 21) and the bottom two third of the UMs as ZEB1 low (n = 42). (I) Correlation coefficients are calculated based on the microarray data set (GES22138), showing that expression of critical genes involved in EMT, cell proliferation and differentiation is correlated to that of ZEB1. Mean (M) ± standard deviation (SD). ‘*’ Indicates Student’s t-test p ≤ 0.05, ‘**’ Indicates Student’s t-test p ≤ 0.01.

