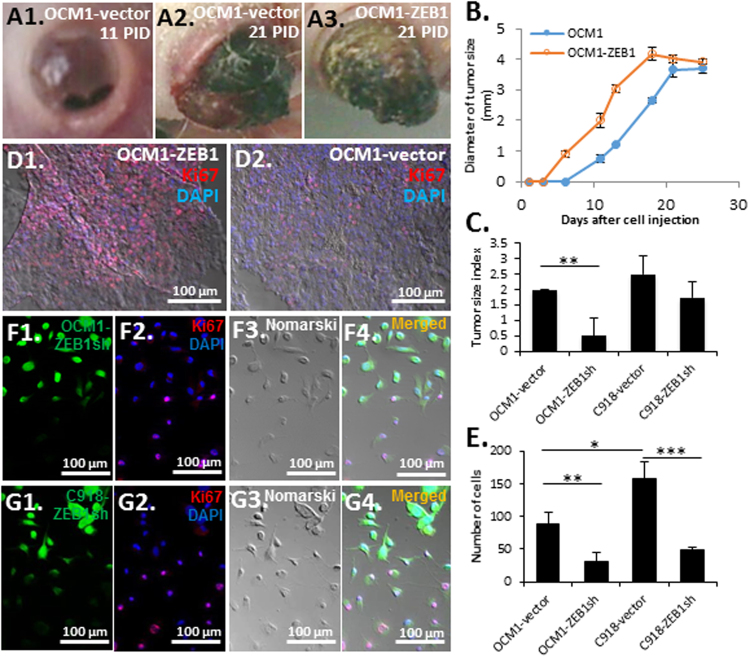
Figure 5.
Effects of ZEB1 on tumor growth and cell proliferation. (A) Representative images showing tumor growth out of the eyes grafted with either OCM1-vector control or OCM1-ZEB1 cells at 11 and 21 post-inoculation day (PID). (B) OCM1-ZEB1 cell-derived tumors appeared 5 days earlier than OCM1 cell-derived tumors, but their growth rates and final tumor sizes were similar. (C) Equal number of cells (2 × 10⁵) of both OCM1- and C918-vector controls and ZEB1sh knockdown cells were intravitreously injected into the nude mice and their 25-day grafted tumors were examined for tumor size evaluation. Based on the tumor H&E-stained sections, tumor size were subjectively classified into ‘No’, ‘Small’, ‘Medium’, and ‘Big’ categories and digitalized as 0, 1, 2, and 3, respectively. The pooled result of total 4 tumors was presented as a tumor size index for each injected cell line (Supplemental Table 5). (D) More mitotic cells were detected by Ki67 immunostaining in OCM1-ZEB1 cell-derived tumors than in OCM1-vector cell-derived tumors. (E) Equal number of cells (1 × 10⁴) were seeded in a 10-cm culture plate. Cells in 5 randomly selected squares (5 × 5 mm2) were counted. Both (F) OCM1-ZEB1sh and (G) C918-ZEB1sh cells were cultured on a chamber slide and immunostained with the mitotic marker Ki67 (red) before confluence. As knockdown levels of ZEB1 were consistent with the expression of EGFP (green), EGFP-dim thereby ZEB1higher cells showed more Ki67 positive than those EGFP-bright thereby ZEB1lower cells. Mean (M) ± standard deviation (SD). Student’s t-tests were performed. *indicates p ≤ 0.05; ** Indicates p ≤ 0.01; *** Indicates p ≤ 0.001.

