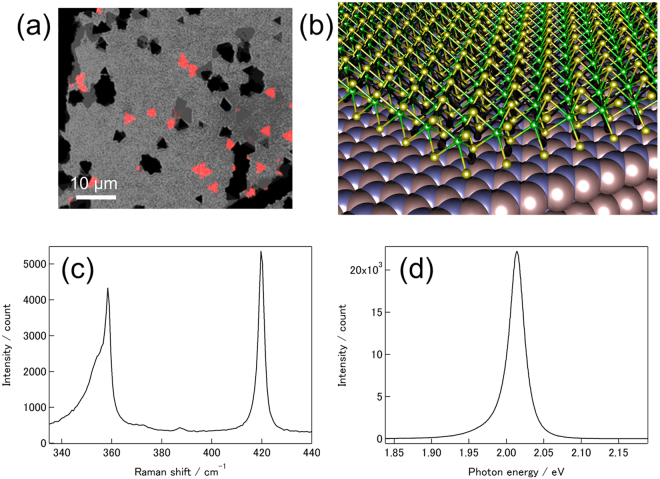
Figure 1.
(a) A PL image of WS2/hBN. The PL image was taken with 488 nm excitation. This image is combination of transmission bright field image (monochrome) and 600–700 nm detection (red). (b) Structure model of WS2 grown on hBN. Yellow, Green, blue and orange spheres represent sulfur, tungsten, nitrogen and boron atoms, respectively. B and N atoms are drawn with van der Waals radii, and Mo and S are drawn with the ball-and-stick model. (c) A typical Raman spectrum of WS2/hBN. (d) A typical PL spectrum of WS2/hBN. The excitation energy of 2.54 eV was used to measure the Raman and PL spectrum.

