
Figure 2.
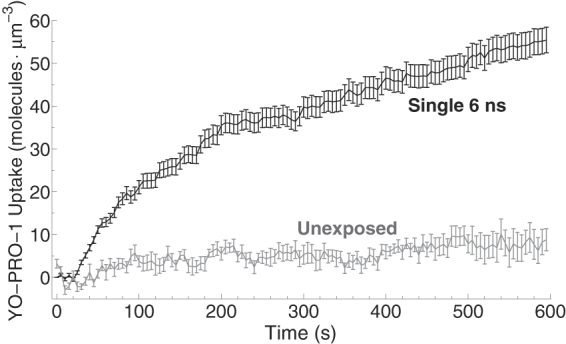
Uptake of YP1 after application of a single, 6 ns, 20 MV/m electric pulse delivered at t = 22 s. Control (unexposed) cells from the same experiments (n = 10) exhibit very much slower uptake. After an initial rate of about 180 YP1 · cell−1 · s−1, net uptake slows to nearly zero at about 200 s, then resumes at a slower rate, about 25 YP1 · cell−1 · s−1 (n = 157).