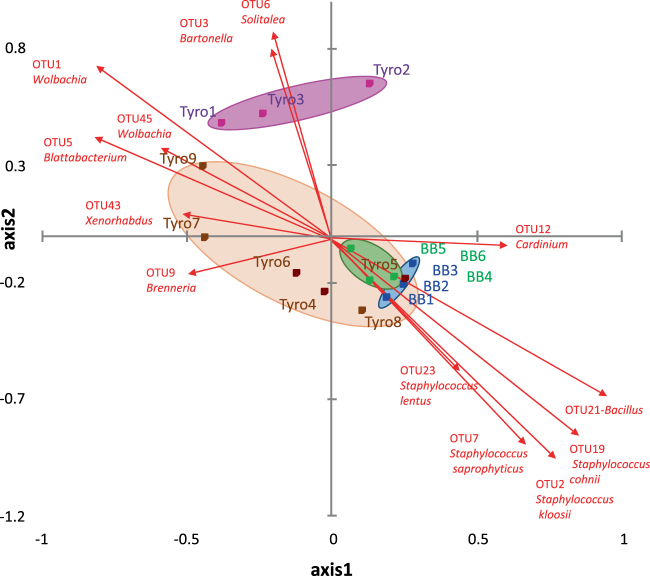
Figure 3.
Principal coordinate analyses (PCoA) of microbiota in the samples of predatory (N. cucumeris) and prey (T. putrescentiae) mites. The microbiome was analyzed using Bray-Curtis dissimilarity matrix; OTUs responsible for significant differences between microbiotas are represented by arrows (calculated via Pearson correlation coefficient). BB1-3 = N. cucumeris (laboratory); BB4-6 = N. cucumeris (mass-reared); Tyro1-3 = T. putrescentiae laboratory culture without the presence of predatory mite (pure) and Tyro4-9 = from N. cucumeris mass-rearing The samples are described in Table 1, the OTUs are identified in Table S1.

