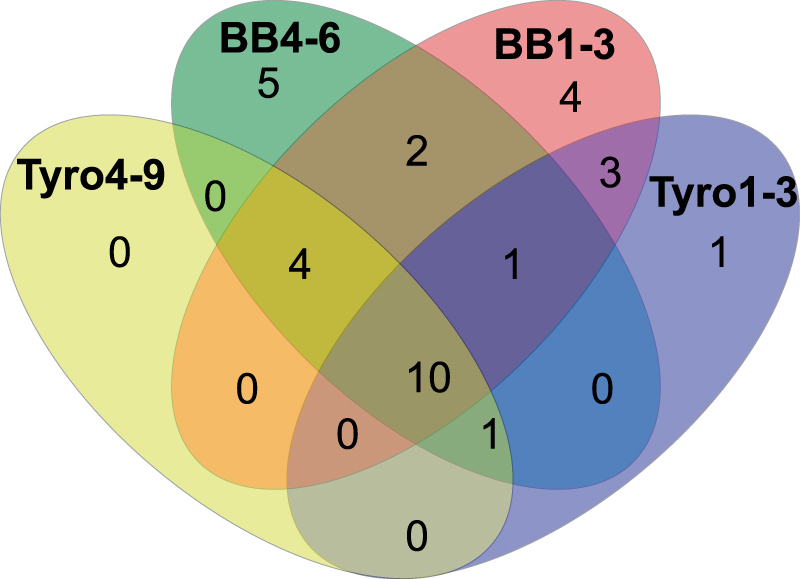
Figure 4.

Qualitative comparison of shared and unique bacterial taxa belonging to predatory and prey mite microbiota by Venn diagram. The compared samples include predatory mites (Neoseiulus cucumeris) from the mass-production population (BB1-3) and the population with disease symptoms (BB4-6); the prey mites (Tyrophagus putrescentiae) from pure laboratory cultures without predators (Tyro1-3) and from the mass rearing production population with the presence of predators (Tyro4-9). The diagram was constructed from the core species per samples. The shared OTUs among all samples were the following taxa ordered by decreasing relative abundance: Staphylococcus kloosii (OTU2), Wolbachia (OTU1), Blattabacterium-like (OTU5), Bartonella-like (OTU3), Solitalea-like (OTU6), Staphylococcus saprophyticus (OTU7), Staphylococcus cohnii (OTU19), Bacillus cereus (OTU21), Cardinium (OTU12), Brevibacterium siliguriense (OTU16). Brenneria (OTU9), Staphylococcus lentus (OTU23), Kocuria koreensis (OTU25) and Xenorhabdus innexi (OTU43) were shared by predatory mites (BB1-3 and BB4-6) and prey mites from the mass rearing production population (Tyro4-9). Wolbachia (OTU45) was shared by predatory mites (BB1-3 and BB4-6) and prey mites from pure laboratory cultures without predators (Tyro1-3). Arthrobacter (OTU47) was shared by predatory mite population with disease symptoms (BB4-6) and both populations of the prey mites (Tyro1-3 and Tyro4-9).
