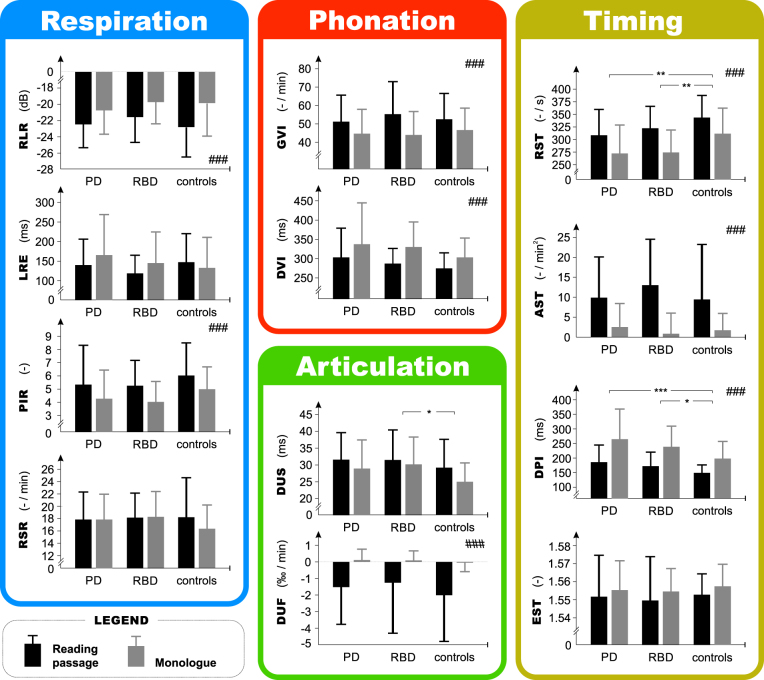
Figure 3.
Results of acoustic speech analyses. Bars represent mean values and error bars represent SD values. Repeated measures analysis of variance (RM-ANOVA) was used to test for group differences: GROUP (PD vs. RBD vs. controls): corrected *p < 0.05, **p < 0.01, ***p < 0.001 after Bonferroni adjustment; TASK (reading passage vs. monologue): corrected # p < 0.05, ## p < 0.01, ### p < 0.001 after Bonferroni adjustment. None of the features showed significant GROUP × TASK interaction. RST = rate of speech timing, AST = acceleration of speech timing, DPI = duration of pause intervals, EST = entropy of speech timing, DUS = duration of unvoiced stops, DUF = decay of unvoiced fricatives, DVI = duration of voiced intervals, GVI = gaping in-between voiced intervals, RSR = rate of speech respiration, PIR = pause intervals per respiration, RLR = relative loudness of respiration, LRE = latency of respiratory exchange, PD = Parkinson’s disease, RBD = rapid eye movement sleep behaviour disorder.

