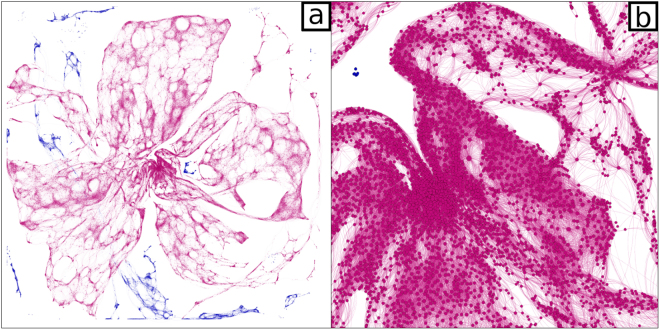
Figure 1.
The network of olive orchard in Puglia. (a) Full view. (b) 10X zoom of the central region. Dots represent olive orchards, while links join all pairs of orchards at a distance of less than 1 km, depicting possible pathways of spread for Xylella fastidiosa. Edges and nodes belonging to the largest connected component (LCC) of the network are colored in magenta, while all other nodes and edges are colored in blue.

