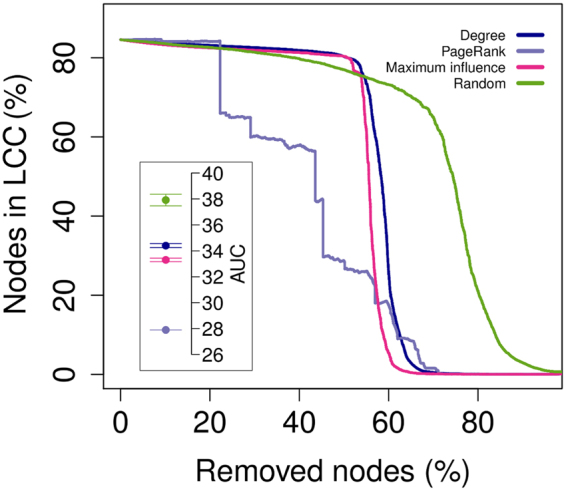
Figure 3.

Effort needed to immunize the olive orchard network. Lines show the fraction of nodes remaining in the largest connected component (LCC) of the olive orchard network after progressive node removal according to different criteria (see Methods). The solid lines interpolate the average values of 100 replicates. The inner box reports the average areas under the curve (over 100 replicates) for each removal criterion, rescaled between 0 and 100, with error bars indicating standard deviations.
