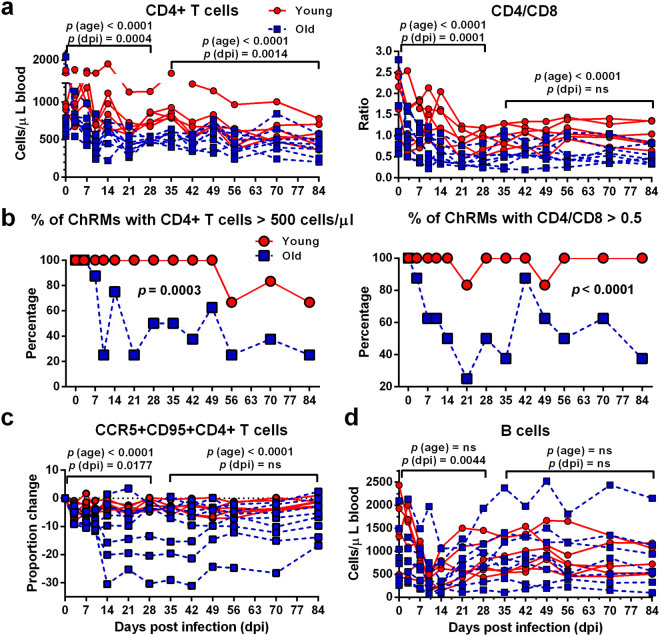
Figure 2.
Old ChRM display an increased depletion of CD4+ T cells, as compared with young ChRM. (a) Longitudinal assessment of CD4+ T cell numbers and the CD4/CD8 ratio in the peripheral blood of the young (n = 6, red circle) and old (n = 8, blue square) groups during the 84 days after infection (dpi) is shown in dot plots. (b) The frequency of animals with CD4+ T cells > 500 cells/μl blood or a CD4/CD8 ratio > 0.5 within the young and old groups. P values were determined using the Mann-Whitney t-test. (c) The dynamics of CCR5 expression by CD95+CD4+ memory T cells in the peripheral blood is shown as the differences in frequency at each dpi relative to day 0. The data are shown as the mean ± SEM. (d) Longitudinal assessment of B-cell levels in the peripheral blood of ChRM during early SIV infection. P (dpi) < 0.05, statistically significant differences over the acute or postacute phase, as determined by two-way ANOVA. P (age) < 0.05, statistically significant differences between the young and old groups, as determined by two-way ANOVA.

