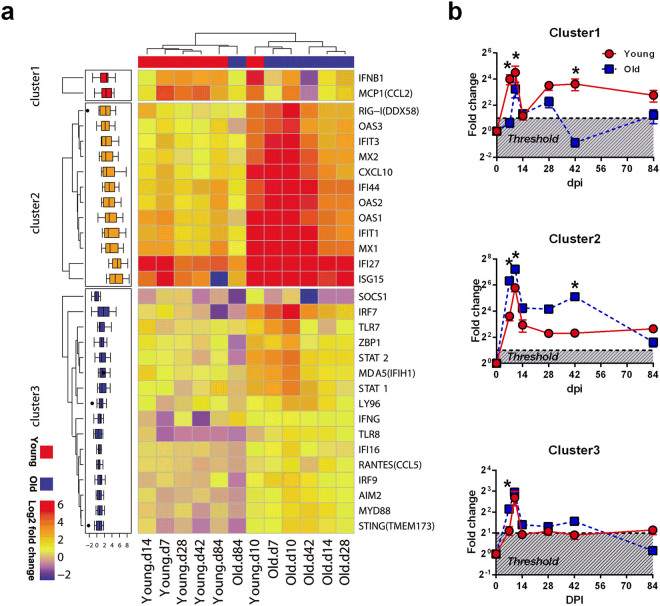
Figure 6.
Acute SIV infection induces a robust innate host response in old ChRM. (a) Hierarchical clustering of 30 genes significantly induced by SIV infection (dpi = 0, 7, 10, 14, 28, 42 and 84) and differentially expressed between the young (n = 6) and old (n = 6) ChRM. Clustering was performed on the average of log2 ratios of mRNA expression relative to levels before infection by the RT-PCR-based ΔΔCt method. The genes were clustered on the basis of their expression value across samples using Euclidean distance and k-mean clustering. The progressive increases in mean log2-fold-change are represented by blue to red colors. (b) Graphs that display the characteristics of the three distinct clusters revealed in the left heat map. The threshold represents the credible induction by SIV infection for more than a 2-fold up-regulation of gene expression. The data are shown as the mean ± SEM. *P < 0.05 between the young (red circle) and old (blue square) groups, as determined by uncorrected Fisher’s LSD test post two-way ANOVA.

