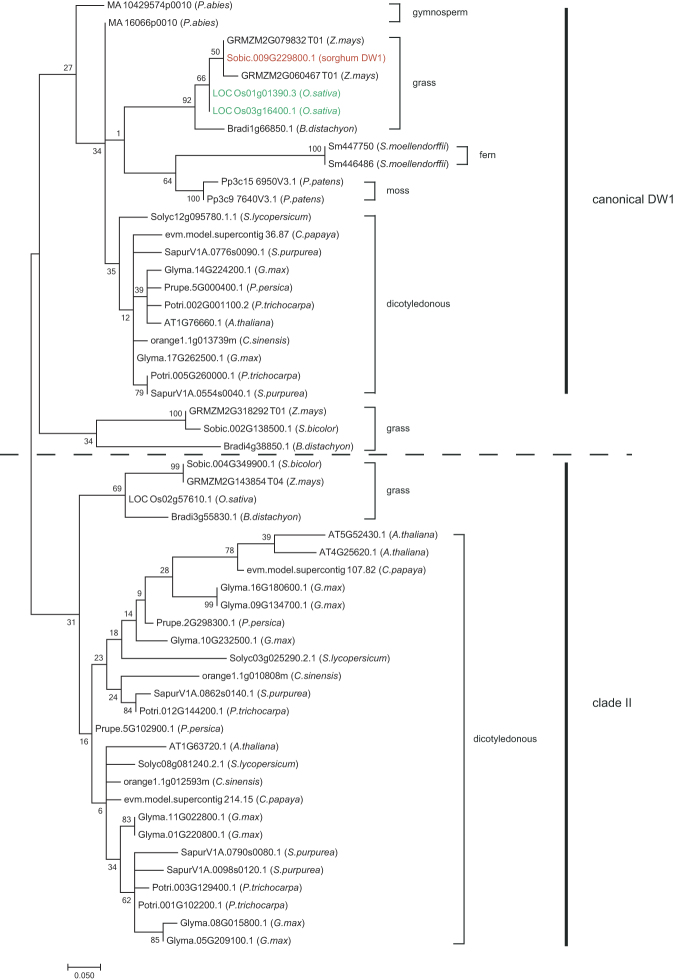
Figure 6.
Phylogenetic analysis of DW1 homologs. A maximum likelihood tree based on the JTT model38 was obtained. The horizontal branch lengths are proportional to the estimated number of amino acid substitutions per residue. Bootstrap values were obtained by 100 bootstrap replicates. SbDW1 are shown in red, and rice DW1 homologs used to create the RNAi rice are shown in green.

