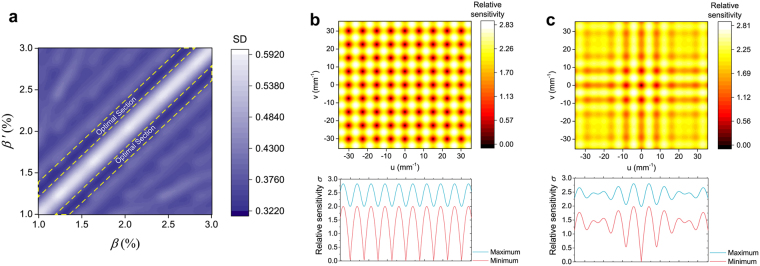
Figure 4.
Optimization of lateral shear pair for wideband sensitivity enhancement. (a) Map of the standard deviation (SD) of spectral sensitivity distribution when the two lateral shear ratios β and β′ vary from 1% to 3%. The optimal lateral shear pairs come with low values of SD and are located in the two valleys along each side of the diagonal of the map, which are marked out in this figure. (b) Spectral sensitivity distribution when the two lateral shear ratios β and β′ are both 1.88%. The spatial frequency range was calculated based on the actual image size on the CCD camera and the spatial resolution. The blue and red lines show the maximum and minimum relative sensitivities on each frequencies of u, while zero sensitivities are obtained at multiple frequencies. (c) Spectral sensitivity distribution when the two lateral shear ratios β and β′ are 1.88% and 1.57%, respectively. There is only one zero point which is the central point with zero frequency and almost all the spectral relative sensitivities except four points in the center are above 1.0.

